iCPlate2
EN
33
iCPlate2
3•Operation
3
3.8 Measuring a plate characteristic curve
The user can change from the standard display to the plate
characteristic curve function by selecting the symbol for the plate
characteristic curve function
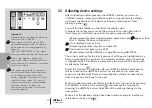
You will find the toolbar on the left side of the LCD with
the following functions:
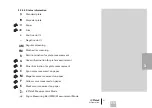
The following information is shown in the LCD:
•
Reference curve:
this is drawn in light gray. The sample points
(patches being measured) are indicated by vertical lines at the
corresponding locations.
•
Plate characteristic curve:
this is drawn in black, with the curve
being adjusted accordingly after each measurement.
•
Next patch to be measured:
the nominal value of the next patch to
be measured is shown on the lower left edge of the Y axis and its
expected reference value is shown above it. If all of the patches
have been measured this display is empty.
•
Current measurement value:
the measurement value of the patch
just measured is shown in black on the top left corner of the Y axis
and the expected reference value is shown below it. If no patch has
been measured yet after a restart, this display will be empty.
A black arrow on the X axis gives a graphic representation of the
next nominal value to be measured.
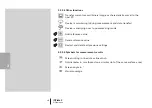
Reset all measurement values
Reset the last measured value and measure again
Transfer the characteristic curve to the host PC via RS232
Back to previous display
Summary of Contents for iCPlate2
Page 1: ...iCPlate2 EN iCPlate2 Plate Measuring Device User Guide Edition 2 1 ...
Page 2: ......
Page 6: ......
Page 12: ......
Page 14: ......
Page 38: ...iCPlate2 38 ...


