Pixie-4 Express User Manual
Version 4.21
May 18, 2016
11
4.2 Histogramming Parameters
The data loaded from the file is a list of energies and time stamps. To process this list into
a histogram, first specify the following parameters
1.
Define the channels to plot (0..3) and the window (in ns) for which events are considered
coincident.
Note: The coincidence window in the P
ARAMETER
S
ETUP
panel is used for data
acquisition – events further apart than specified are not recorded. The coincidence
window specified here is for plotting recorded events in the 2D energy spectrum.
2.
Specify the scaling factor to map the DSP energy range into the histogram bins. The
DSP energy can range from 0 to 65535. To map the full range into the default 256 bins
in each direction, choose a scaling factor of 256 for both x and y. If the measured
energies are less than 65535, decrease the scaling factor to “zoom in” to a certain region
of interest,
3.
Specify the offset applied to the DSP energy before scaling. An offset of 0 means energy
0 falls to bin 0 of the histogram, and the maximum energy in the histogram is
65536/scaling factor. If only energies over a certain value should be displayed, enter
that value as the offset. For example, offset 1000 will map the energy rage from 1000
to (65536/scaling 1000) to bins 0 to 256.
4.
Specify which channel to plot as x and y. Choices are the energies of the first (left) or
second (right) channel specified under 1. or the time difference between them.
As described in section 1.5, only energies of
related
events are plotted, i.e., the pulses
occurred within the specified coincidence window in the 2 channels. In other words,
plotting of energies in a 2D MCA includes specification of the 2 channels, computation
of the time difference as described above, and then plotting only those events with
Tdiff < CW in the 2D histogram.
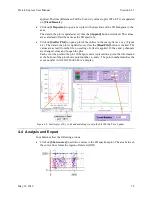
After changing any of the parameters, click
[Clear/Rescale]
to initialize the histogram,
then click
[Append]
to process the list of energies into the histogram. Additional data files
can be appended into the histogram by selecting the new file(s) and clicking
[Append]
without
[Clear/Rescale].
For higher resolution data, check the
High Resolution
box. This changes the number of
bins from 256 x 256 to 4096 x 1024. Display updates may become quite slow on low
performance PCs.
4.3 Additional Plots
There are 3 additional plots and tables to view the data:
Click on
[Table]
to open a table of the energy lists. Table rows correspond to the event
number in
THE
L
IST
M
ODE
T
RACE
display.
The data in the table is updated every time the
[Read File]
button is clicked. The values
for energy, TrigTime, and LocalTime are as read from the file, no scaling or offset is
1
2
3
4


