background image

Pixie-4 Express User Manual 


Version 4.21  


May 18, 2016 


14 


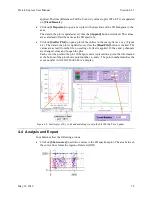
Figure 4-3: The T

IME 

D

IFFERENCE

 panel.  Three time differences can be defined between any 2 

channels and histogrammed.  

Summary of Contents for Pixie-4 Express

Page 1: ...p www xia com Information furnished by XIA LLC is believed to be accurate and reliable However no responsibility is assumed by XIA for its use or for any infringements of patents or other rights of th...

Page 2: ...Plotting Functions 6 1 2 System Requirements 6 1 3 Software Overview 6 1 4 Support 6 1 5 Principle of Operation 7 2 Installation 8 3 Data acquisition settings 9 4 Offline Analysis 10 4 1 File I O 10 4...

Page 3: ...wer before accessing the Pixie module s on board switches and jumpers Detector and Preamplifier Damage Because the Pixie module does not provide power for the detector or preamplifier there is little...

Page 4: ...ice under this warranty a to repair damage resulting from attempts by personnel other than XIA LLC representatives to repair or service the product or b to repair damage resulting from improper use or...

Page 5: ...Text in quotation refers to window titles and quotations from other sources Options indicates the window accessed via Tools Options Italics Italic text denotes a new term being introduced or simply em...

Page 6: ...and 1D projections Export as ASCII text and other formats TDC histograms offline 1 2 System Requirements The advanced energy plotting functions require the Pixie Viewer software version 4 21 or higher...

Page 7: ...discussion is for data acquired with this run type The event record includes flags to indicate which channel actually saw a pulse in the current record hit For those channels that did not see a pulse...

Page 8: ...the top level folder of the Pixie software distribution typically C XIA Pixie4e Open the Pixie Viewer variant by double clicking Pixie_Ecoinc pxp Initialize the variant specific global variables by se...

Page 9: ...of 4 channels So for example if one out of 4 channels is piled up nothing is recorded for any channel unless pileup rejection is turned off for that channel It is best to disable pileup rejection and...

Page 10: ...llowing sections Figure 4 1 The 2D SPECTRUM display Data shown is from a coincidence setup of a HPGe detector and a NaI detector with a Na 22 source 4 1 File I O The name of the file to plot can be en...

Page 11: ...rage from 1000 to 65536 scaling factor 1000 to bins 0 to 256 4 Specify which channel to plot as x and y Choices are the energies of the first left or second right channel specified under 1 or the tim...

Page 12: ...ot is updated every time the Read File button is clicked The values are as read from the file no scaling of offset is applied If the x and y channels are changed close and re open the plot Each event...

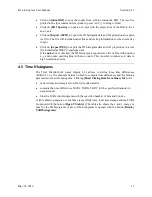
Page 13: ...h position x y and counts omitting bins with zero counts This is useful to reduce zero data in high resolution spectra 4 5 Time Histograms The TIME DIFFERENCES panel Figure 4 3 allows to define three...

Page 14: ...Pixie 4 Express User Manual Version 4 21 May 18 2016 14 Figure 4 3 The TIME DIFFERENCE panel Three time differences can be defined between any 2 channels and histogrammed...

Page 15: ...osen to be computed between channel 0 and 1 smaller panel lower right Clicking Read Timing Data Extracts times and energies from the list mode data file Computes the time differences TdiffA TdiffB Tdi...

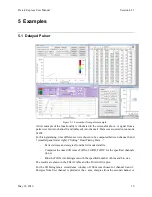
Page 16: ...4500 DSP units 1 2MeV and E 1800 DSP units 511 keV for HPGe on the x axis and E 800 DSP units 511 keV for NaI on the y axis The 511 511 keV coincidence peak is the area with the highest counts The acq...

Page 17: ...Pixie 4 Express User Manual Version 4 21 May 18 2016 17 Figure 5 2 Screenshot from HPGe NaI example...

Reviews: