XIIMUS R-GB-IR CL User Manual. Version 1.2
7. OPTICAL
CONSIDERATIONS
7.1 Spectral
response
0
10
20
30
40
50
60
70
80
90
100
300
350
400
450
500
550
600
650
700
750
800
850
900
950
1000
1050
1100
Wave le ngth (nm )
T
ran
sm
issi
o
n
(
%
)
Bluegreen
Red
Infrared
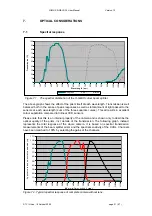
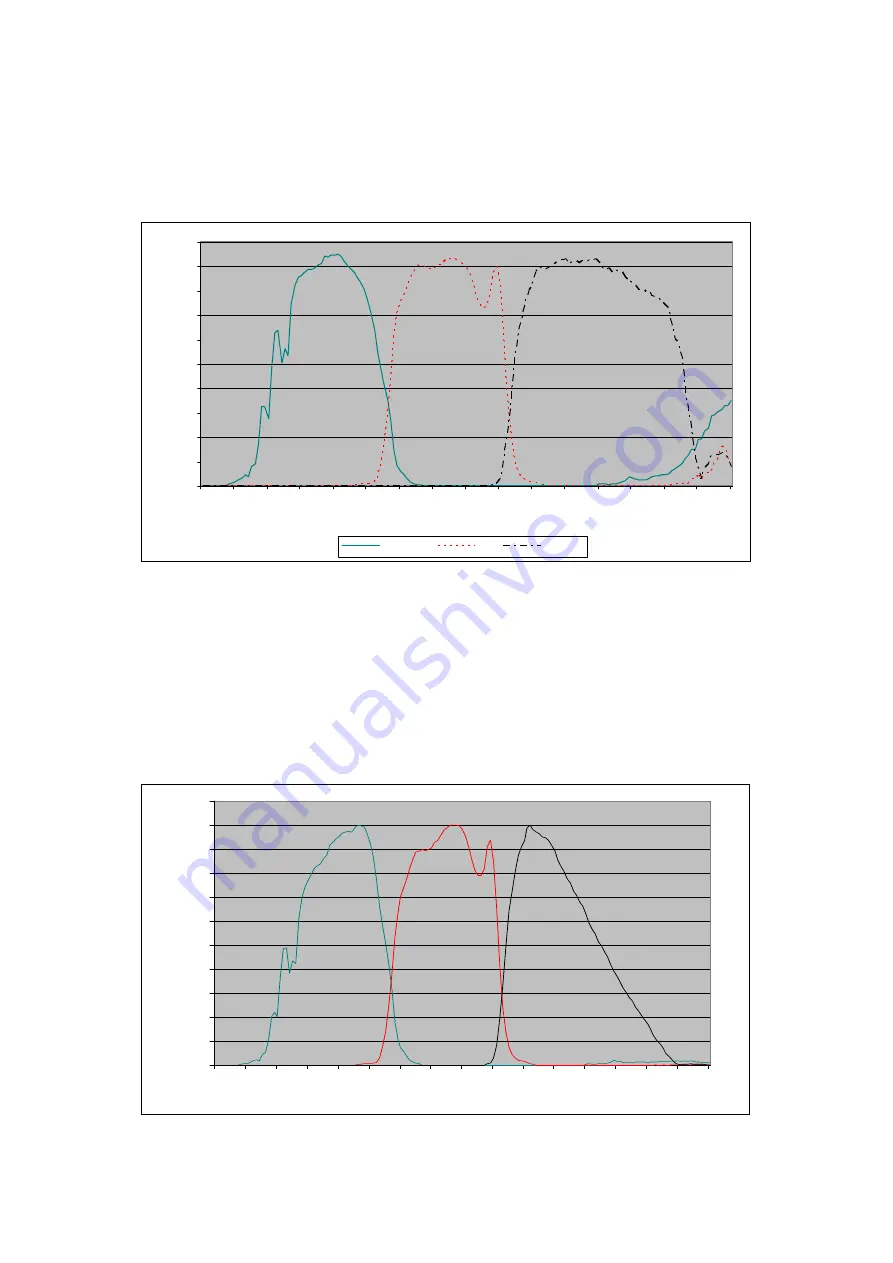
Figure 7.1. The spectral distribution of the R-GB-IR colour beam splitter.
The above graph shows the effect of the prism itself at each wavelength. Transmission is well
balanced both in the sense of peak responses as well as total amount of light passed to the
sensors at each wavelength (sum of the three separate curves). This all results in excellent
colour separation compared to trilinear CCD sensors.
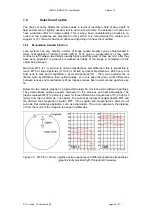
Please note that this is an internal property of the camera and is shown only to describe the
optical quality of the prism, incl. details of the transmission. The following graph, instead,
represents the total response of the whole camera. It is based on spectral transmission
measurements of the beam splitter prism and the spectral sensitivity of the CCDs. Channels
have been matched to 100% by selecting the gains of the channels.
0
10
20
30
40
50
60
70
80
90
100
110
300
350
400
450
500
550
600
650
700
750
800
850
900
950
1000
1050
1100
W a v e l e n g h t ( nm )
T y
p
i
c a
l
r
e
l
a t
i
v
e s
p e
c t
r
a
l
r
e
s p o n s
e (
%
)
Figure 7.2. Typical spectral response of complete camera without lens.
© TVI Vision, 18 October 2006 page 21 ( 57 )


