31
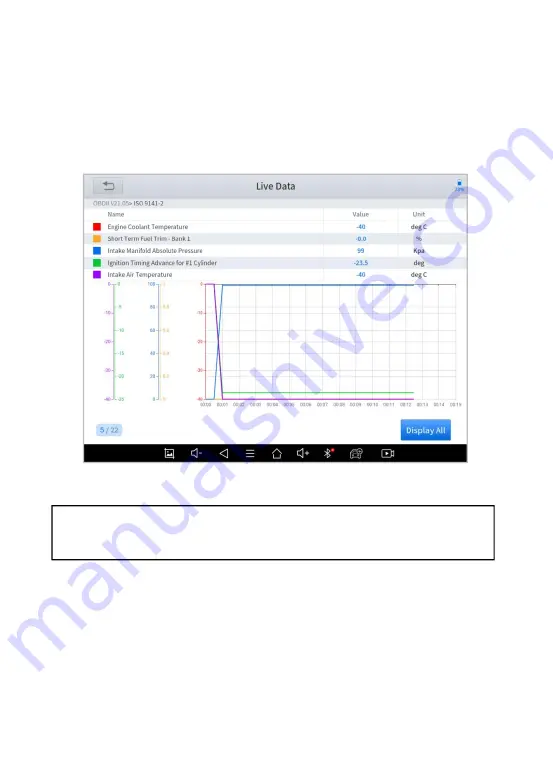
Click Display All, back to the page which display all PIDs
Combine
Support to select multiple PIDs and click
【
Combine
】
to make
different graphs into one chart.
Figure 4-14 Sample of the PIDs Combination
Data recording
Supports recording the current data value in the form of text, you can
view the recorded files in
Reports->Data Replay.
Pause
Click this button to pause the timeline of timeline
Note: When customizing the graphs, the number of PIDs selected
at a time should not exceed 5


