15
Outputs
This sections determines what is done with
the data once it’s received by Storm3. Data
can be logged internally to Storm3’s log file
(this is selected by default). Data can also be
transmitted via Cellular Modem, Modbus, or
GOES radio (figure 10).
Now that the new sensor is added, fully
configured, and connected navigate back to
the ‘Home’ navigation tab and the ‘System
Overview’ submenu. Enable scanning and
Storm3 will begin measuring and logging
data from the added sensor at the specified
scan rate.
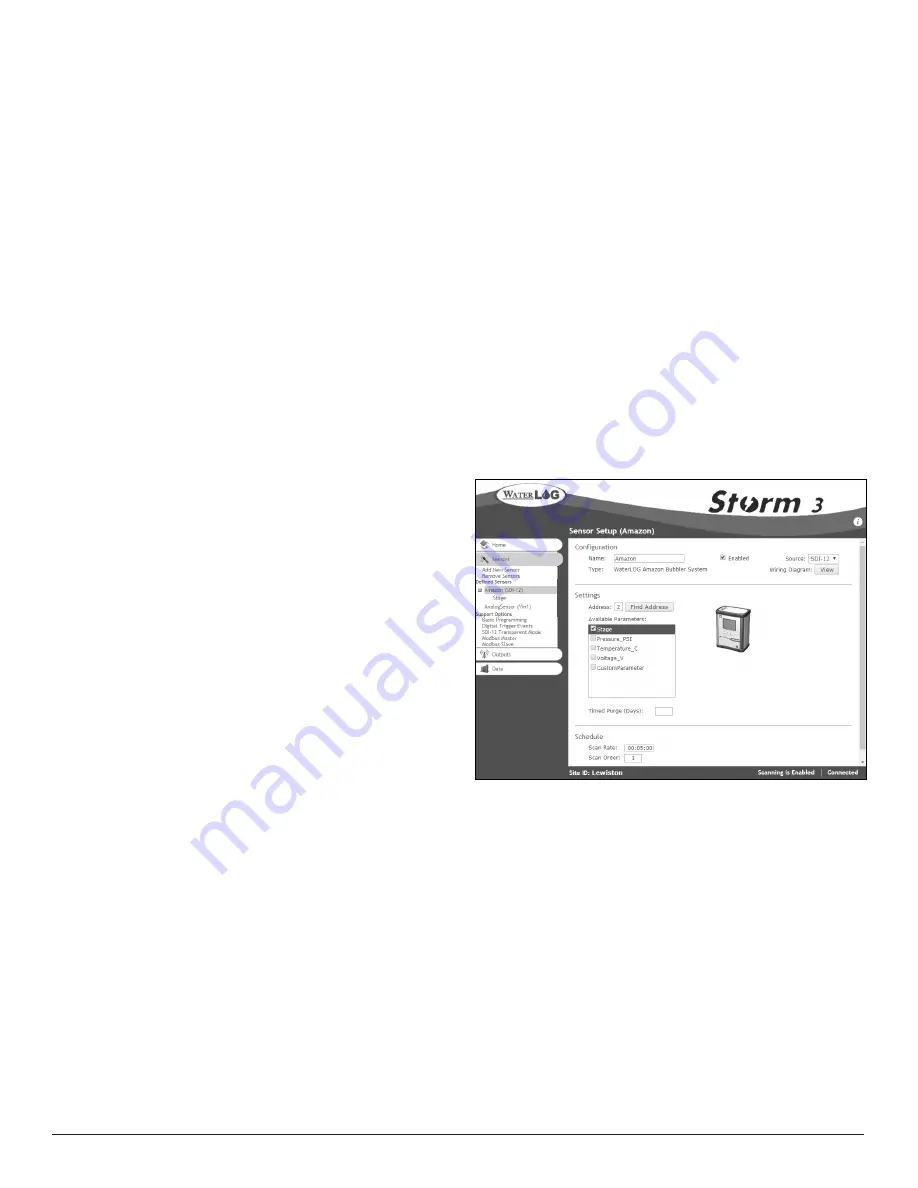
Figure 10: Sensor Setup (Outputs)
Data Retrieval
To retrieval data or download data navigate to the ‘Data’ navigation tab. The ‘File Operations’
screen will open and display the collected data in a graphical view as well as provide options for
downloading, renaming, or deleting the selected file. Collected data can be easily downloaded
directly to your PC or to an attached USB flash drive. The complete file can be downloaded or the
download can be selected to start form a specific date. Select ‘To PC’ or ‘To USB’ from the drop
down menu for either the complete file or from a specified Date/Time and select the ‘Save’ button.
Processing
This section of the Sensor Setup page deals with anything related to the measured value from the
sensor. Slope and Offset is assigned here as well as how many digits passed the decimal will be
recorded. There is also a ‘Use Function’ section if additional mathematical manipulation of the
sensor’s measured value is desired. The Raw Value and the Processed Value from the sensor are
displayed. The Processed Value is the value logged and or transmitted.
Schedule
The rate the sensor will be measured (the scan rate) is entered here. The scan order is also displayed
and or adjusted here.
Settings
The Settings section will change to accommodate the different styles of sensors. For example, the
settings for an SDI-12 sensor will differ from those of an Analog sensor.
Setup & Operations


