www.yictechnologies.com
5 dB above the average noise floor of the scan. By default, the maximum number of
peaks is set to 10. The maximum number peaks that can be measured is 30.
5. Peak Hold:
Also known as Max-Hold this is a very important feature as it allows you to
run a Spectral Scan continually replacing the peak amplitude with each successive
higher measurement. This is an excellent way to find the frequency of an intermittent or
random signal.
6.
Spectral Averaging:
In the Run Continuously mode, the Spectral Scan is constantly
updated with the average between the new measurement and the average of the
previous measurements. It is a very important feature to help you identify the more
persistent noise that could affect pre-compliance.
7. Replace Data When Running Continuously:
If you Scan Continuously when this option
is checked, EMScanner software replaces the previous scan data and keeps the last
scan data. In order to keep all scan data, uncheck this option.
8. Spectrum Analyzer in DC Coupled Mode:
When this option is checked, the analyzer
goes from the protected AC mode to the unprotected DC mode. This enables a much
lower noise floor in the low frequency range, usually below 10 MHz, depending on the
spectrum analyzer. DC voltage applied to the spectrum analyzer input can however
cause damage to the internal circuitry. The DC Coupled Mode is currently available for
the Keysight EXA below 10 MHz and PSA below 20 MHz. New drivers
must be developed on demand for any other spectrum analyzer. Contact Y.I.C.
Technologies (
support@yictechnologies.com
)
9. Click Apply
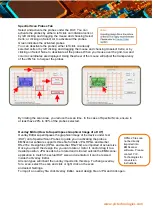
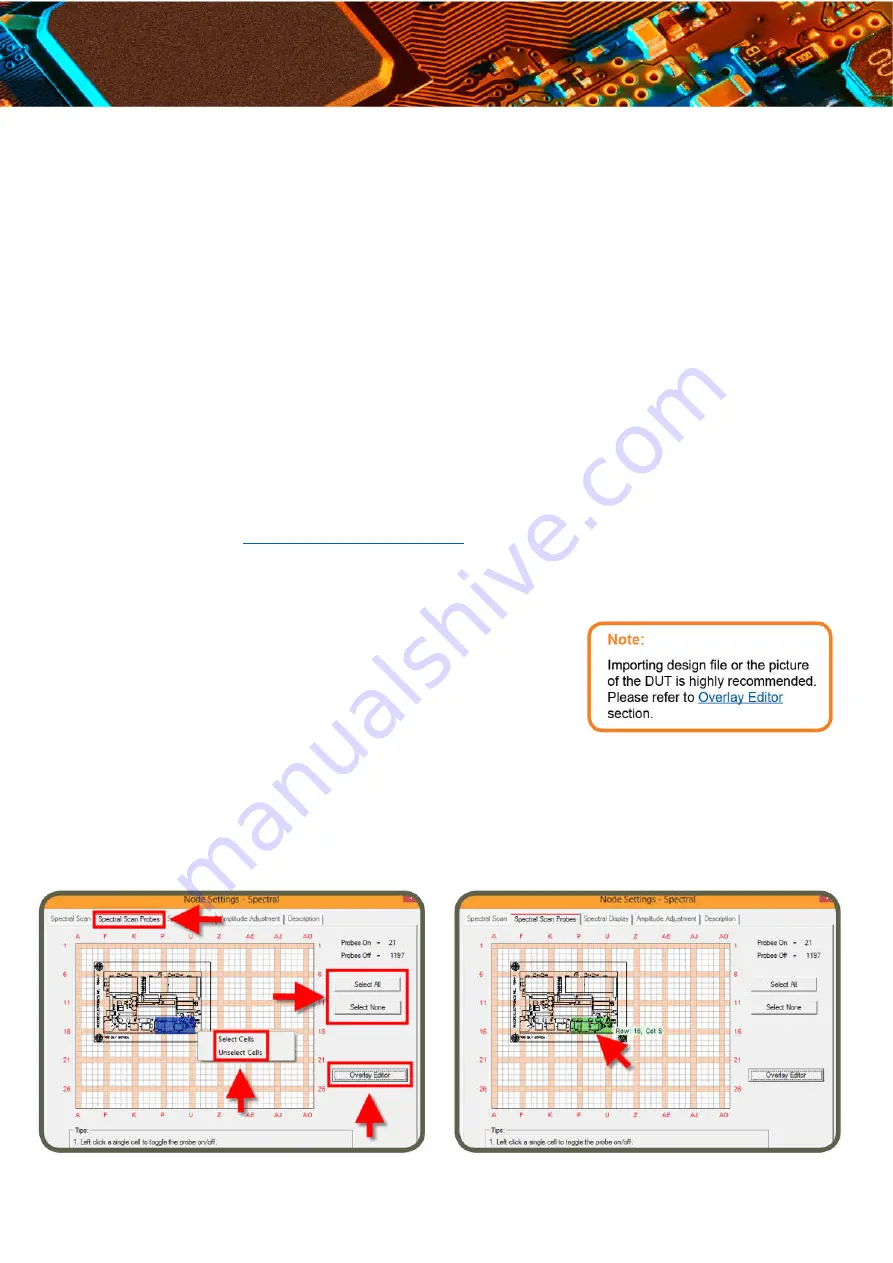
Spectral Scan Probes Tab
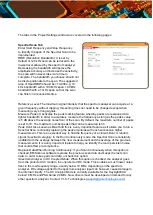
Select and activate the probes under the DUT. You can
activate the probes by either a left click on individual cells or
by left clicking and dragging the mouse and choosing Select
Cells; or clicking on Select All to activate all of the probes.
Green indicates the activated probes.
You can deactivate the probes; either left click on already
selected cells or by left clicking and dragging the mouse and choosing Unselect Cells; or by
clicking on Select None to deactivate all of the probes.
When you mouse over the grid, row and column coordinates are displayed.
Using the wheel of the mouse will adjust the transparency of the JPG file to help set the
probes.

