www.yictechnologies.com
Multi Frequency Marker
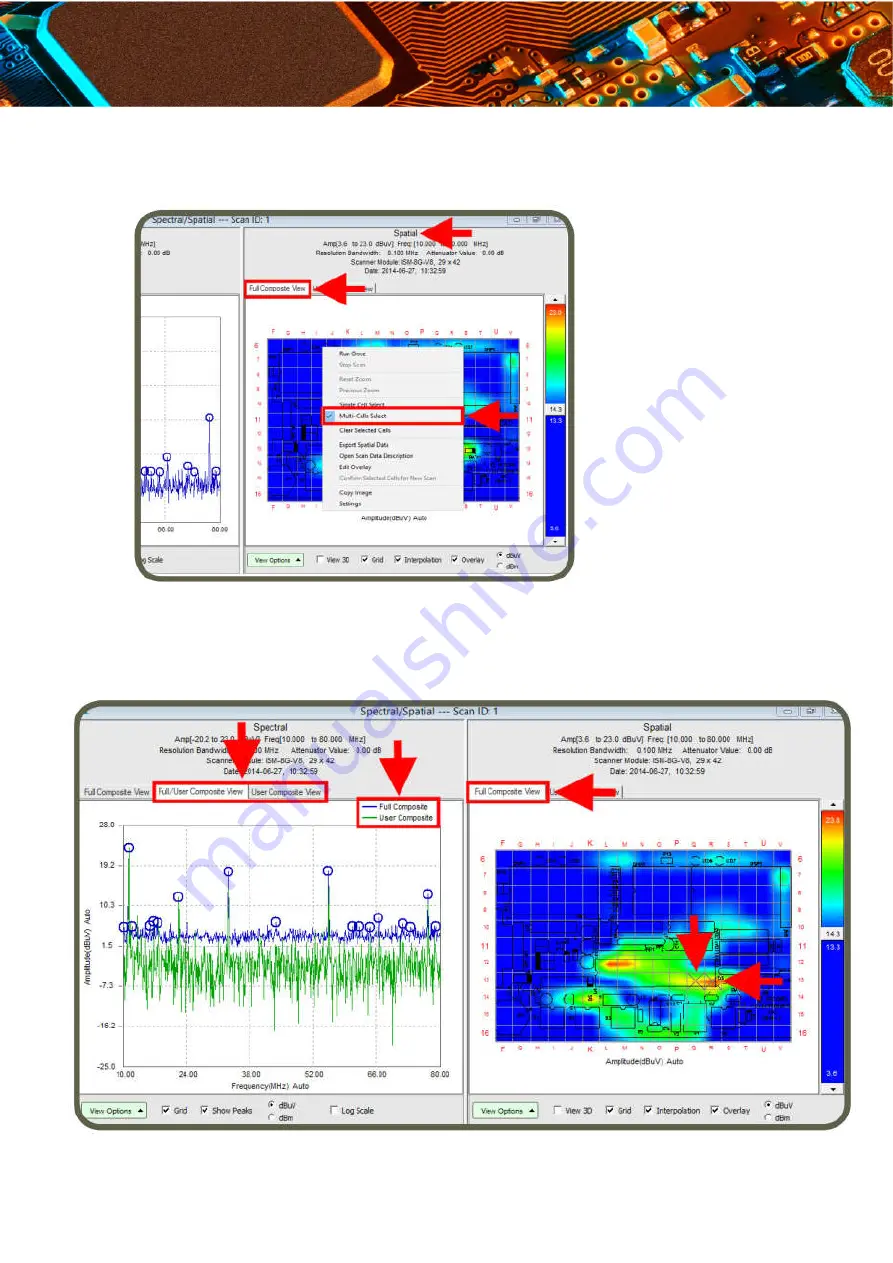
Right click on the spatial graph and select Multi-Cells Select.
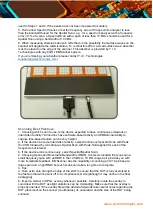
Select multiple cells of
interest on spatial
graph. A cross will indicate the selection. Full/User Composite View tab overlays spectral
graph of user selected cells on to the full spectral graph. Spectral graph of the selected cell
will be displayed in green on the spectral graph.


