www.yictechnologies.com
Spatial View
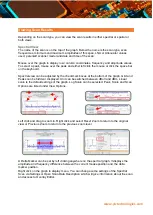
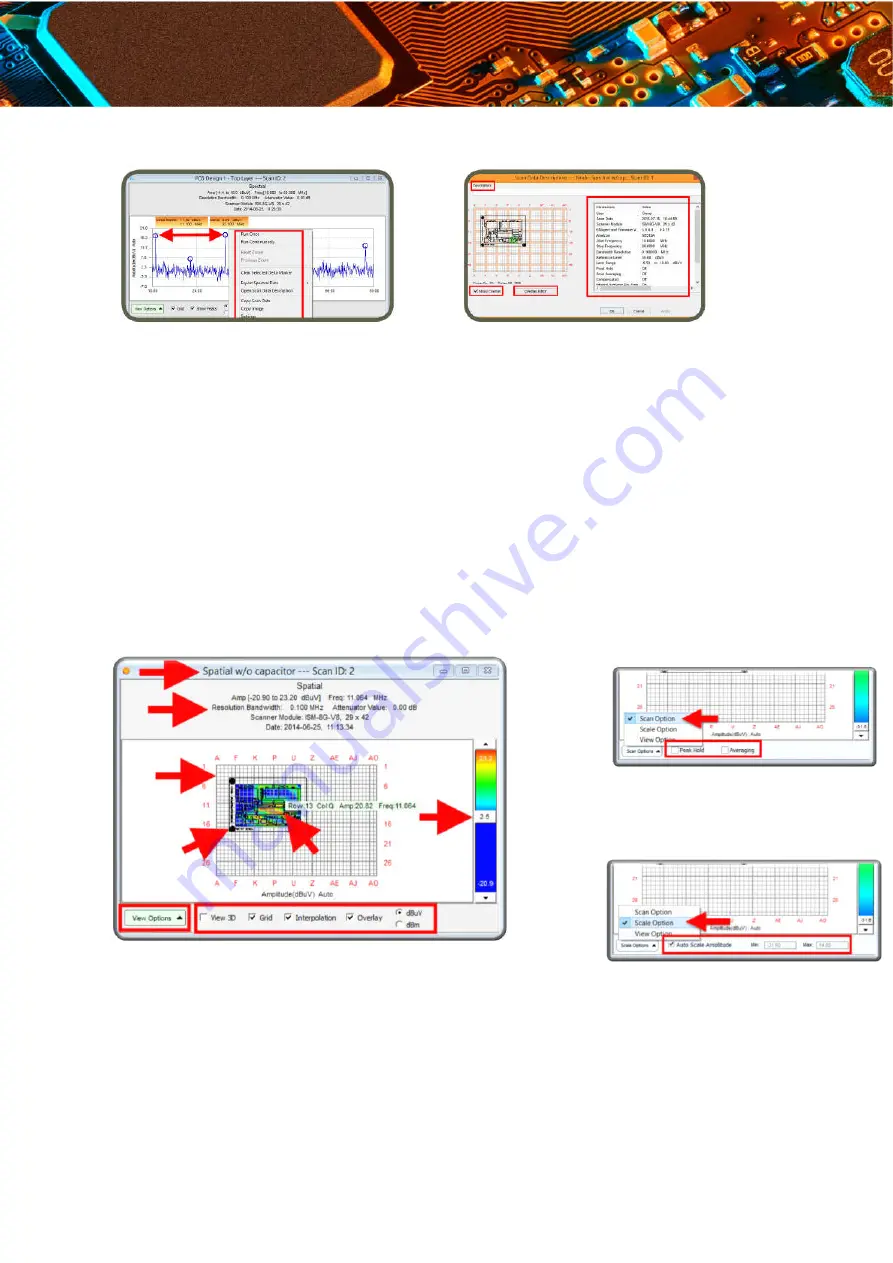
The name of the scan is on the top of the graph. Below name is the scan type, scan
frequency, minimum and maximum amplitudes of this frequency, LNA or Attenuator values
used, patented scanner model and date and time of the scan.
Mouse over the graph to display row / column coordinates, frequency and amplitude values.
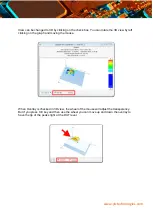
Spatial view can be adjusted by the checkmark boxes at the bottom of the graph. Grid and
Overlay can be hidden / displayed. Interpolation (degree of data smoothing in the image) can
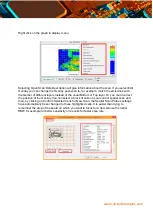
be turned on / off. By sliding the Set Colour Threshold on the right side of the graph, you can
increase or decrease the contrast to more clearly identify current loops and peak locations.
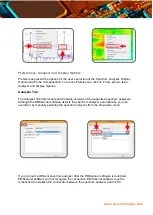
Scale and Scan Options are listed under View Options.


