www.yictechnologies.com
Spectral Overlay
A Spectral Overlay is a qualitative comparison of two frequency spectra. It displays two data
sets superimposed on each other, which allows you to visually inspect data for differences,
i.e. presenting a qualitative view.
The Spectral Overlay node allows you to observe and compare two Spectral Scans with the
same resolution bandwidth within their common overlapping range overlapping frequency
range even though they may have different frequency ranges e.g.: Spectral 1: 10 MHz - 80
MHz and Spectral 2: 30 MHz - 120 MHz.Add Spectral Overlay node to Project node. Node
settings window automatically opens.
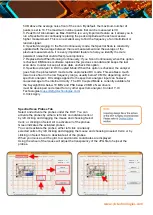
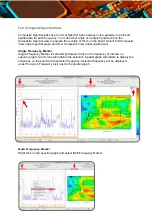
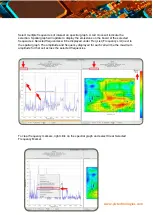
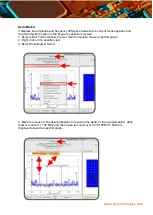
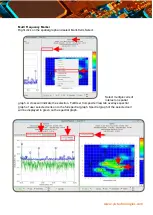
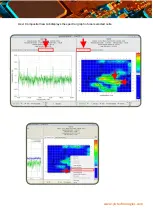
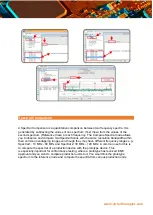
After you click OK, Spectral Overlay window opens. Go to the Spectral View. Select the data
from the data list that you want to overlay and click & drag & drop it on to Test View. Repeat
these steps for the second data and drop it on to Reference View. Click Overlay View tab
and mouse over the graph.

