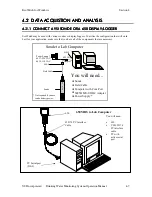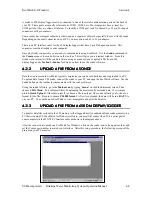
EcoWatch for Windows
Section 4
YSI Incorporated
Drinking Water Monitoring Systems Operation Manual
4-3
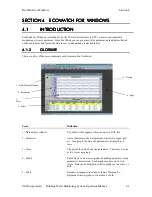
EcoWatch starts without an open data file (or .DAT file). When a data file is not open, a shortened menu
bar is visible and many of the tools in the toolbar appear dimmed. Opening a data file will better
demonstrate the capabilities of EcoWatch software.
To open the sample data file:
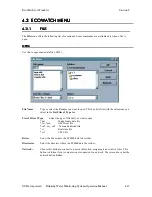
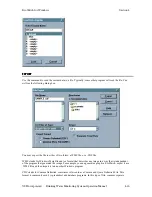
1. Click the
File
menu
button in the toolbar.
2. Select the
SAMPLE.DAT
file.
3. Click
OK
to open the file.
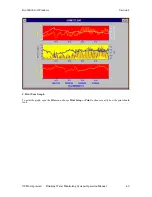
Note that the data in this file appears as a graph of temperature, specific conductance, dissolved oxygen,
pH, ORP, and depth, all versus time. The graphs are scaled automatically so that all data fits comfortably
on the computer screen.
The
Table
and
Graph
buttons on the toolbar are on/off switches that are used to display or hide
the graph and table pages respectively. When displaying a graph and a table at the same time, you can
control the relative size of the two pages by placing the cursor over the small bar that separates them and
then dragging it to the desired location.
From the
Setup
menu, click
Graph
. Click
2 Traces per Graph
and notice that the parameters are now
graphed in pairs. Click
1 Trace per Graph
to return the display to the original setting.
Move the cursor to any position in the graph, then click and hold the right mouse button. Note that the
exact measurements for this point in time are displayed to the left of the graph. While holding down the
right mouse button, move to another area on the graph. Notice how the measurements change as you move.
When you release the mouse button, the display returns to normal.
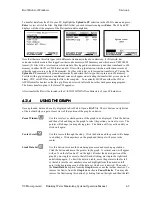
To view statistical information for the study, click the
Statistics
button on the toolbar. On the
statistics window, click on any min or max value to display the time when it occurred. Double-click in the
upper left of the Statistics window to return to the normal display.
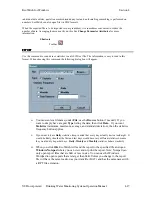
End the tutorial by saving the Data Display in the format shown. To do this:
1. From the
File
menu, click
Save Data Display
.
2. Type Default for the file name when prompted for the Data Display Name.
3. Click
Save
.
The parameters, colors, format, and x-axis time interval associated with the current display are now saved
and can be accessed any time in the future. Nine different data displays may be saved for any data file.
You can easily switch between various displays of the data.
This demonstration shows only a small part of the capability of EcoWatch. You may wish to also review
the procedures involved in the
Section 4.1.5
,
Typical Application
.
4.1.4
4.1.4
4.1.4
4.1.4
USING THE TOOLBAR
USING THE TOOLBAR
USING THE TOOLBAR
USING THE TOOLBAR
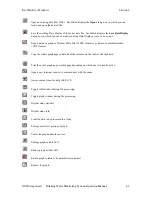
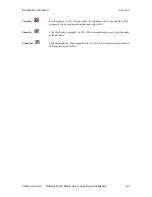
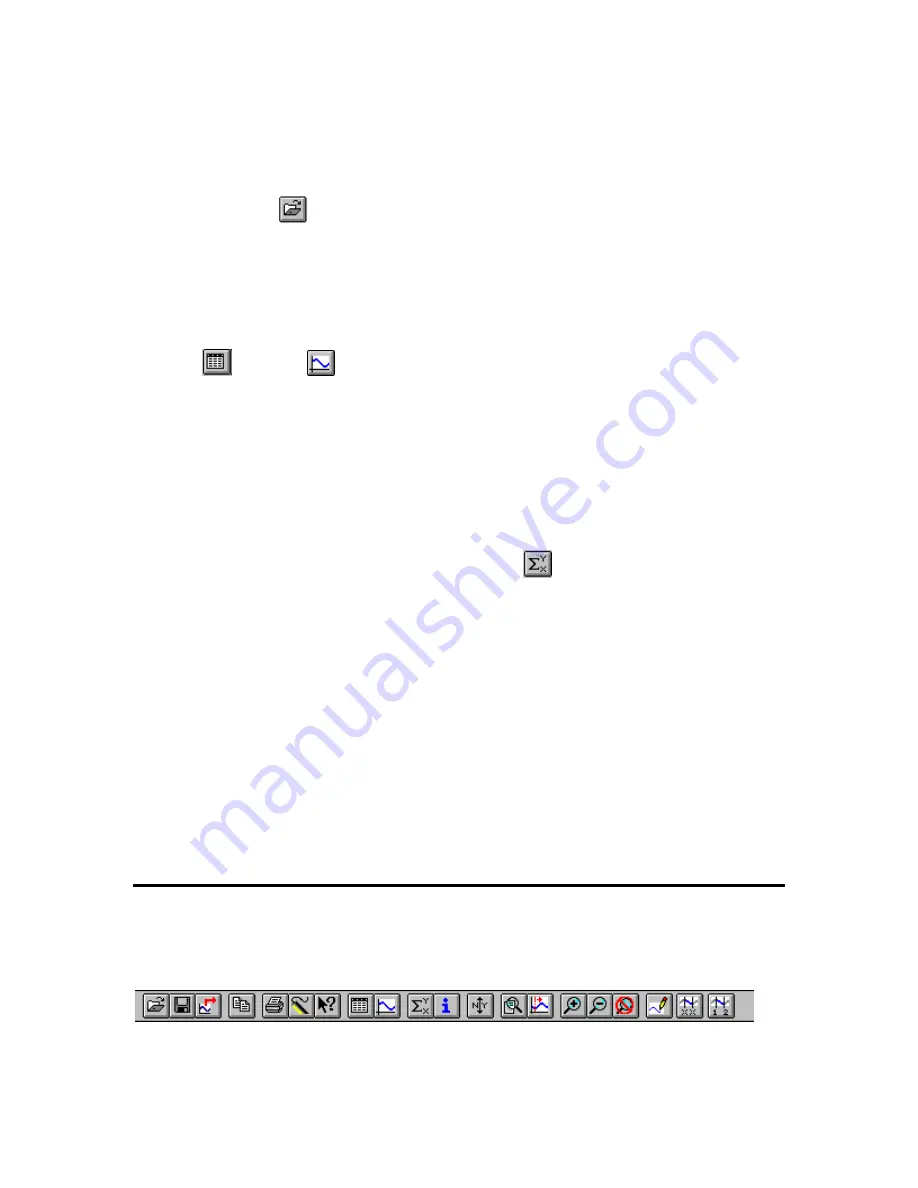
The EcoWatch toolbar includes buttons for some of the most common commands in EcoWatch, such as
File Open
. To display or hide the toolbar, open the
View
menu and click on the
Toolbar
command. A
check mark appears next to the menu item when the toolbar is displayed.
The toolbar is displayed across the top of the application window, below the menu bar.
Click To:

