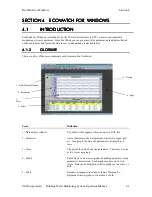
EcoWatch for Windows
Section 4
YSI Incorporated
Drinking Water Monitoring Systems Operation Manual
4-5
4.1.5
4.1.5
4.1.5
4.1.5 TYPICAL
APPLICATION
TYPICAL APPLICATION
TYPICAL APPLICATION
TYPICAL APPLICATION
Suppose you want to measure Dissolved Oxygen, pH, Temperature, and Turbidity in a nearby stream and
decide to start with a 30-day deployment using the YSI 6920 sonde. The task can be organized into several
steps:
1. Calibrate and setup the sonde.
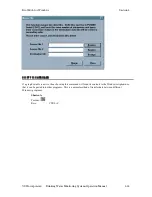
First connect your sonde to one of the serial communications ports on your PC. In the
Comm
menu, click
Sonde
and you will get a terminal window where you can calibrate the sonde and set it up for logging. You
are now communicating directly with the sonde software. See
Section 2.6, Calibration
for more detailed
instructions on calibration of sensors. See
Section 2.5, Sonde
Software Setup
for sonde setup.
2. Deploy the Sonde
For more details, see
Section 2, Sondes and Section 3, Displays/Loggers
.
3. Retrieve the Sonde and Upload the Data
After retrieving the sonde, connect it to your PC and upload the data. As with calibration and setup, you
can use the Sonde
button in EcoWatch to communicate with the sonde. Using the sonde menu, upload
the data to EcoWatch. The data will now be in a .DAT file on your PC.
4. Graph the Data and Adjust the Graphs to Your Liking
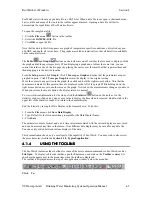
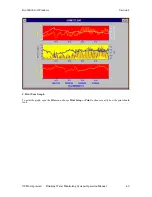
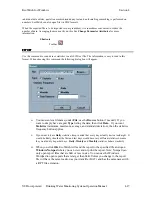
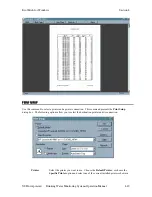
Open the newly uploaded .DAT file. In this example, the file is called JONES2.DAT. Upon opening the
file it looks like the graphic at the end of this tutorial. You can then use the commands in the
Graph
menu
to
Zoom
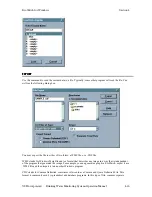
to the portion of the graph that you are most interested in. You can use the
Setup
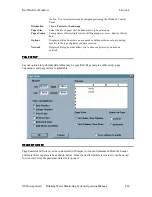
menu to add a
title or change colors, scale the graphs or select the parameters to be shown.

