Principles of Operation
Section 5
YSI Incorporated Drinking Water Monitoring Systems Operation Manual
5-15
(2) If unusually high or jumpy readings are observed during the calibration protocol, it is likely that there
are bubbles on the optics. Manually activating the wiper of the 6026 or 6136 from a computer or 650
MDS keypad removes these bubbles.
(3) When calibrating the 6136 sensor, be aware of the fact that precautions must be taken to avoid
interference of the bottom of the calibration vessel. Instructions for two methods of calibrating the 6136
sensor are provided in Section 2.6.1 of this manual. The best solution to the interference problem,
however, is to purchase the 655488 Extended Calibration Cup Sleeve which completely eliminates the
issue.
The sonde turbidity system allows the user to either observe these real turbidity events (while obtaining
somewhat jumpy readings) or to apply a mathematical filter to the raw data so that the NTU output may be
more reflective of the overall cloudiness of the environmental sample. From the
Advanced|Data Filter
menu of the sonde software, the user can activate the data filter that is specific to turbidity and “fine tune”
its performance. For typical sampling and monitoring applications, YSI recommends that the Data Filter
settings be selected as follows: Enabled -- On; Wait for Filter -- Off; Time Constant = 12; Threshold =
0.010.
For most unattended sampling applications, selection of the above filter settings should also be appropriate.
However, an additional capability is also available which enhances the elimination of spurious single point
spikes from the logged data and thus allows for a better presentation of the average turbidity during the
deployment. This “
Turb Spike Filter
” is activated/deactivated in the
Advanced|Sensor
menu. Its
capability is further described in
Section 2.9.8,
Advanced
. YSI recommends the use of this feature for all
unattended studies. The user should determine from experience whether its activation is also appropriate
for spot sampling studies at particular sites.
5.12
5.12
5.12
5.12 CHLOROPHYLL
CHLOROPHYLL
CHLOROPHYLL
CHLOROPHYLL
INTRODUCTION
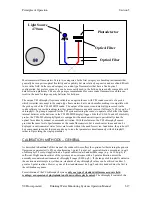
Chlorophyll, in various forms, is bound within the living cells of algae, phytoplankton, and other plant
matter found in environmental water. Chlorophyll is a key biochemical component in the molecular
apparatus that is responsible for photosynthesis, the critical process in which the energy from sunlight is
used to produce life-sustaining oxygen. In general, the amount of chlorophyll in a collected water sample
is used as a measure of the concentration of suspended phytoplankton, the magnitude of which can
significantly affect the overall quality of the water.
The use of the measurement of phytoplankton as an indicator of water quality is described in Section 10200
A. of
Standard Methods for the Examination of Water and Wastewater
. The classical method of
determining the quantity of chlorophyll at a particular site is to collect a fairly large water sample and
analyze it in the laboratory. The procedure involves filtration of the sample to concentrate the chlorophyll
containing organisms, mechanical rupturing of the collected cells, and extraction of the chlorophyll from
the disrupted cells into the organic solvent, acetone. The extract is then analyzed by either a
spectrophotometric method using the known optical properties of chlorophyll or by high performance
liquid chromatography (HPLC). This general method is detailed in Section 10200 H.
of Standard Method
and has been shown to be accurate in multiple tests and applications as long as a competent laboratory
analyst carries out the protocol. The procedure is generally accepted for reporting in scientific literature.
The method is time-consuming, however, and usually requires an experienced, efficient analyst to generate
consistently accurate and reproducible results. It also does not lend itself readily to continuous monitoring

