27
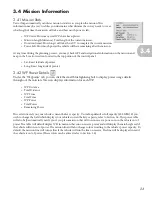
You may obtain specific information on any given point by clicking the mission line in the desired area.
• Click the mission line exactly where you want to obtain information.
• If you successfully clicked the desired area, an ‘X’ will appear on the line at the point of the click.
• The information on that point is displayed in the log information pane located at the bottom of the primary
screen area.
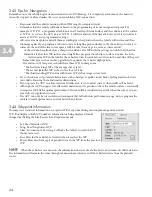
All of the information obtained at that point may be viewed by scrolling left and right with the window arrows at the
bottom of the pane. You may also move up and down through the points to view data at different points throughout
the mission. If you click on a data set, the ‘X’ on the map will move to that point. You may also choose to display select
info on the log mission line when you click it.
1. Right-click anywhere on the primary screen area with log displayed.
2. Select ‘Display Data Popup’ (if it does not already have a check beside it).
3. Right-click again on the primary screen area and select ‘Select Data.’
4. In the ‘Field Selection’ window, double-click any of the data fields that you would like VectorMap to
display.
5. Click ‘OK.’
A tooltip box now appears wherever you click on the log mission line, displaying the information that you selected in
the ‘Field Selection’ menu.
When you overlay the log file, you may notice that the vehicle’s actual path is slightly serpentine. This is due
to the fact that the vehicle constantly navigates towards the mission line. If your survey body does possess a current,
the vehicle will constantly compensate for the current by driving to the line. If it is pushed outside of its acceptable
watch distance from the line, it will return immediately, thereby causing the log to display a wave-like survey pattern.
You may also notice a discrepancy in the depth readings from the vehicle. The depth-sounding sonar on the vehicle is
rated to locate a bottom at 300 feet in
optimal conditions.
Should the vehicle travel approximately 300 feet or so from
the bottom, the log may show a false bottom, or an obviously incorrect reading that shows the bottom 1-10 feet from
the vehicle instead of ~250+ feet. This effect will be obvious due to a quick jump from deep to shallow in DFB data.
Overlay DVL Files
1. Open the desired map file(s).
2. Click file.
3. Select ‘Overlay DVL Log.’
Vectormap displays a pane that contains DVL/ADCP data for each point along it’s path over the original mission
log information pane as well as arrows along the mission line. These arrows indicate the direction of current and its
strength. The longer the arrow, the stronger the current. You can alter how VectorMap displays this data (Section 3.62))
3.53 Create a Safe Return Path
A Safe Return Path is identical to a normal mission aside from a few basic differences. The Safe Return Path(SRP)
operates the AUV by using surface WPs and only begins its mission if a safety rule is engaged. This safety mechanism
can prevent an AUV from running a long course once it recognizes hazardous conditions. Once a SRP engages, the
AUV will drive at the surface to the nearest WP and follow the SRP to its final WP. To create a successful SRP, include
plenty of WPs that are easily accessible from multiple points on the mission so that the vehicle can quickly and easily
access the SRP and return to its destination. To program an SRP, follow these steps.
1. Start a new mission. ‘File’ > ‘Create New Active Mission.’ (from file or TerraServer).
2. Open the existing mission that needs a SRP (‘Overlay Missions’ Section 3.52).
3. Set the new mission as the active mission in the layers panel.
4. Plan your new SRP mission over the normal mission in order to ensure a successful transition should a
safety rule be engaged.
5. Save the file as a .srp.
NOTE
Include both the .mis file and the .srp file when you upload missions into the UVC’s shared mission.
3.5
NOTE


