Reports
The following options exist for each odorizer
Graph
Tabular
Email History
SMS History
Graph
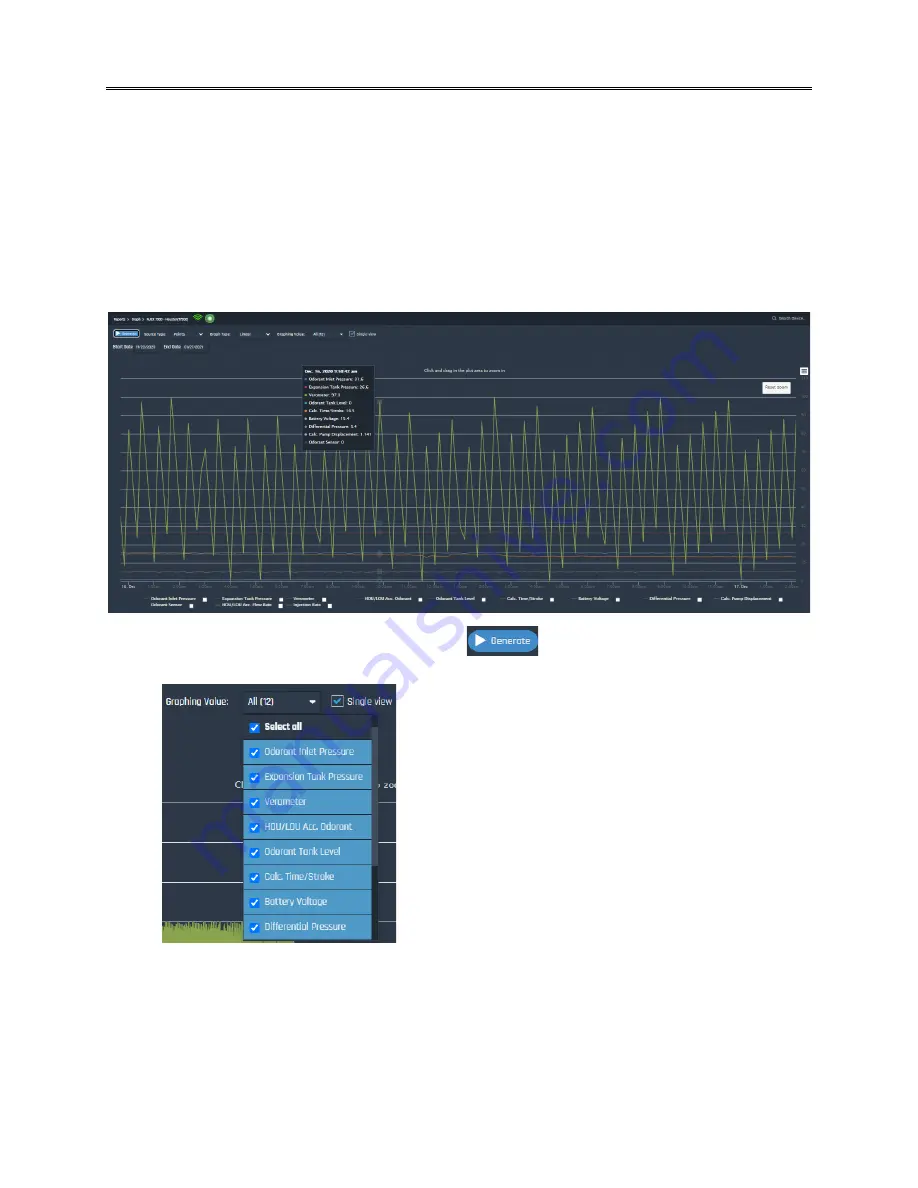
YZ Connect plots the data snapshots taken every 10 minutes for easy viewing. Graphs can be filtered
and customized in a number of different ways:
Choose the date range to view and then click
Filter parameters to graph via the drop down for “Graphing Value”
View all the data individually or in a common graph (Single view)
o
When viewing all the data in a single view:
Click the parameter check box to add a custom Y-scale for the parameter
Click on the parameter name to hide it from the graph
o
Uncheck “Single View” in the upper right to see each parameter graphed separately
Certain parameters like total odorant injected etc. are viewed via the “Graph Type” being
changed to “Accumulated”
Summary of Contents for YZ Connect
Page 1: ...User Manual V1 0...
Page 2: ......
Page 8: ......
Page 25: ...www yz connect com Page 21 of 25 APPENDIX A Panel Control Drawing...


