Electronic Loads
-
19-
potential. Graph 3(
c
) indicates the same situation as described in Graph 3(
b
), however here voltage
drop in the system is also taken into account. The blue line at the y-intercept shows the potential
output between the
+
and
– terminals
of EL1000. A simple schematic is Graph 3(
c
) is also shown
below to clearly indicate the connections of battery (reversed) with EL1000 and external source.
Note:
Normally a cathode (positive terminal) of battery is connected with the
+ terminal
of EL1000
(Graph 4
a
) however during charging (Graph 3
b
,
c
) the anode (negative terminal) of the battery is
connected with the
+ terminal
of EL1000. Hence it is also described as the reverse connection of
battery with EL1000.
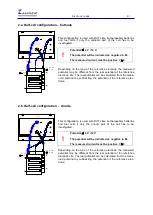
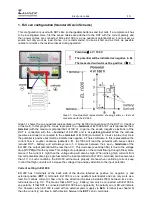
Fig. 02 shows the same connection as shown in Graph 3(
c
). Here, EL1000 will read a potential of less
than 1 V between its
+
and
– terminals
. Here the potential applied by the external power source
should be increase up to an extent that the total potential becomes positive after compensating for the
opposing battery potential and the voltage drop (R).
5.b. Electrolysis of fuel cells
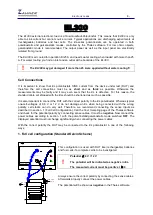
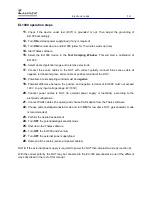
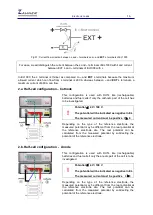
This configuration is used to allow experiments during electrolysis of
fuel cells. Electrolysis of the fuel cell has the same cell connection as
for the section of
5.a. Charging batteries
.
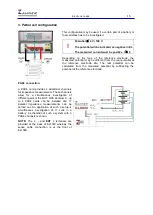
!
Potential
≤
4 V / 100 V
The potential will be indicated as positive in EL.
The measured current must be positive I
≥
0
The graphical representation for fuel cell will also look similar as the
Graph 4 for batteries. However since the individual fuel cell has a
potential of nearly 1.1 V so an external power supply with less
potential is normally used.
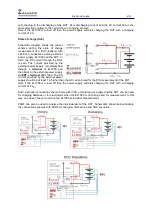
In section 5.a and 5.b, the currents can be disrupted directly from
EL1000. Since external power supply is in series with EL1000 so by
stopping the current in EL1000, the current flow by the external power
supply will also seize.
Fig. 02: EL1000 in series connection with a battery (reversed connections) and an external power source.


