LSM 510
OPERATION IN EXPERT MODE
LSM 510 META
Display and Analysis of Images
Carl Zeiss
03/06
B 45-0021 e
4-279
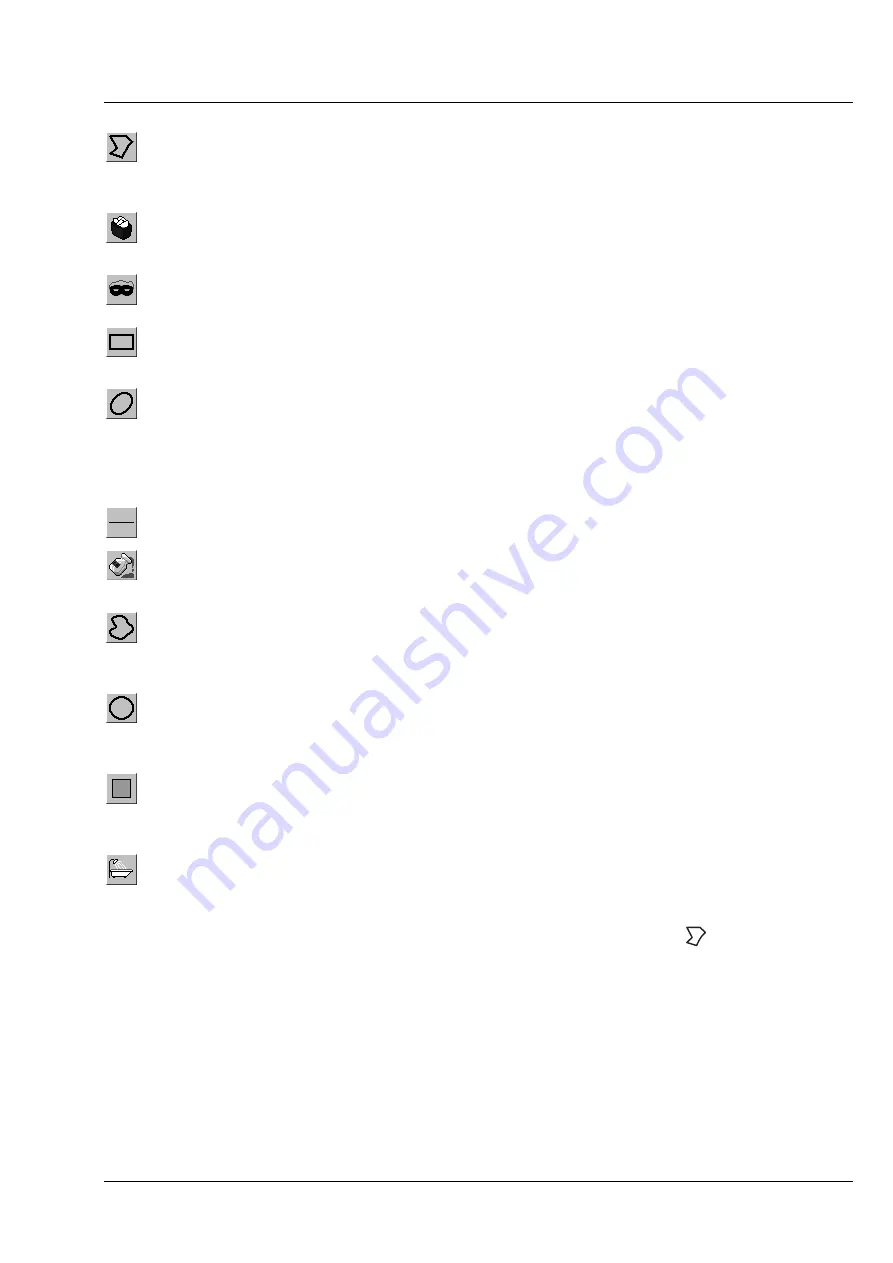
Closed polyline
button: Creation of a polyline figure in the image. The first click sets the
starting point, each additional click adds a further line, a click with the right mouse
button closes the figure and ends the procedure.
Recycle bin
button: All the mask elements are deleted. If one element was marked
before, this element is now deleted from the image.
Mask
button: Enables the
Mask
Mode, where the region can be defined with ink.
Rectangle
button: Creation of a rectangle in the image. Click and hold down the mouse
button, drag a rectangle in any direction, release the mouse button to end the procedure.
Ellipse
button: Creation of an ellipse in the image. The first click sets the center point,
the displayed line permits the determination of the first dimension, the second click sets
the first dimension, the second dimension and the rotation direction can then be
determined; the third click sets the second dimension and the direction and ends the
procedure.
Line
button: Determines the line thickness of the area outline.
Flood fill
button: Fills the overlay element or the scatter diagram with the color selected
under
Mask
.
Closed free-shape curve
button: Creation of a closed Bezier figure in the scatter
diagram. The first click sets the starting point, each additional click adds a further line, a
click with the right mouse button closes the figure and ends the procedure.
Circle
button: Creation of a circle in the scatter diagram. Clicking and holding down the
mouse button sets the center point; drag the diameter and release the mouse button to
end the procedure.
Color selection
button: The colors displayed in the selection box can be assigned to the
mask elements with a click of the mouse. The currently selected color is always displayed
in the larger rectangle (top left) of the selection box.
Clear Mask
button: Removes the color filling from an overlay element or from the scatter
diagram.
•
The function can be activated by clicking on one of the geometry buttons, e.g.
(polyline).
•
The figure of interest can be marked in the image by cursor control in conjunction with a mouse click.
•
If more than one Region is drawn either the mean histogram values for all regions is displayed or only
the values of the activated region if it is marked by clicking on the drawing line with the mouse.
•
Areas can also be excluded from the analysis. By clicking on the
Flood fill
button (paint jar) and
moving the cursor to the area to be excluded causes the remaining area to be computed and the
result indicated under
Area Measure
.
•
If you specify a top and bottom intensity threshold, the area lying within this intensity interval can be
computed.


