Advanced Configuration
118
EtherXtend User’s Guide
Bcast 58
Discards 0
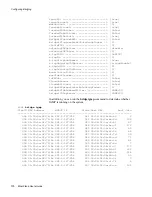
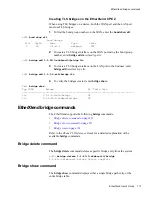
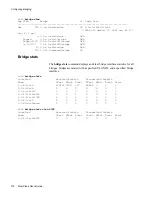
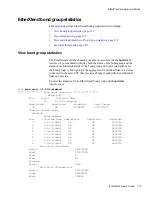
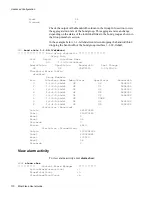
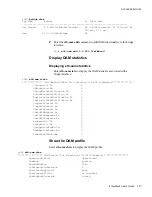
Check the output of the Bandwidth column in the Group Info section to view
the aggregate train rate of the bond group. This aggregate rate can change
depending on the status of the individual links in the bond group as shown in
the Group members section.
In the example below, 1-1-6-0/shdsl went down dropping the bandwidth to 0
dropping the bandwidth of the bond group interface 1-1-99-0/shdsl.
SH>
bond stats 1-1-99-0/efmbond
****************** Bond group statistics ******************
Group Info
Slot GrpId Interface Name
1 99 1-1-99-0/efmbond
AdminStatus OperStatus Bandwidth Last Change
UP UP 39872000 0.00:09:36
Threshold Alarm Config
disabled
Group Members
Port Interface Name AdminStatus OperStatus Bandwidth
3 1-1-3-0/shdsl UP UP 5696000
2 1-1-2-0/shdsl UP UP 5696000
1 1-1-1-0/shdsl UP UP 5696000
8 1-1-8-0/shdsl UP UP 5696000
7 1-1-7-0/shdsl UP UP 5696000
6 1-1-6-0/shdsl UP DOWN 0
5 1-1-5-0/shdsl UP UP 5696000
4 1-1-4-0/shdsl UP UP 5696000
Statistics (Received)
Octets 480675689
Ucast 219070183
Mcast 0
Bcast 96
Discards 0
Errors 8649
Statistics (Transmitted)
Octets 1370394534
Ucast 220924681
Mcast 130519
Bcast 58
Discards 0
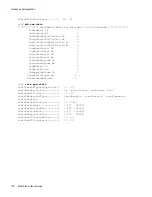
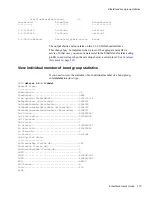
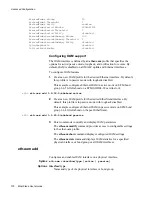
View alarm activity
To view alarm activity enter
alarm show
:
zSH>
alarm show
************ Central Alarm Manager ************
ActiveAlarmCurrentCount :3
AlarmTotalCount :9
ClearAlarmTotalCount :6
Summary of Contents for EtherXtend 3300 Series
Page 8: ...Contents 6 EtherXtend User s Guide...
Page 18: ...Overview 16 EtherXtend User s Guide...
Page 70: ...Basic Configuration 68 EtherXtend User s Guide...
Page 132: ...Advanced Configuration 130 EtherXtend User s Guide...
Page 146: ...IP Service Level Agreement 144 EtherXtend User s Guide...
Page 150: ...Index 148 EtherXtend User s Guide...

