Chapter 6 Monitor
ZyWALL ATP Series User’s Guide
160
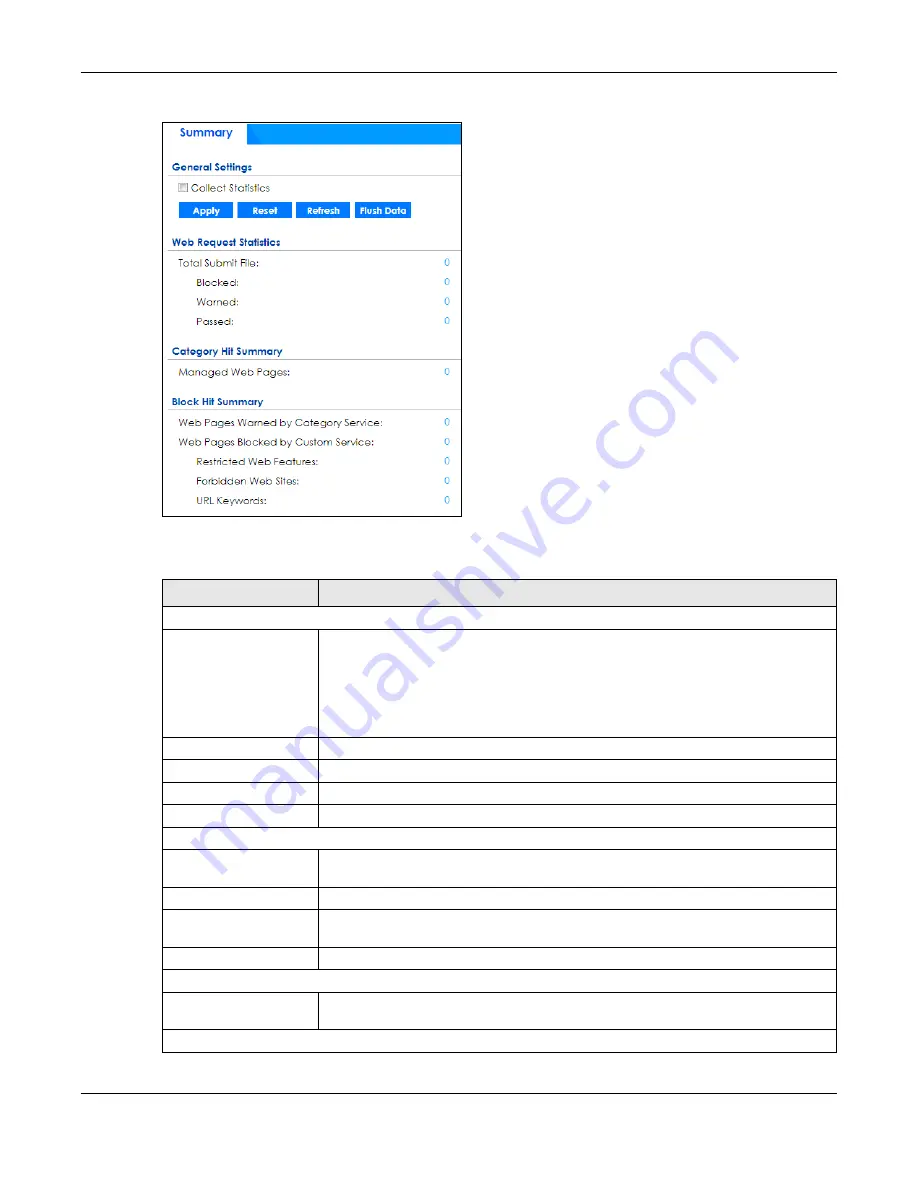
Figure 128
Monitor > Security Statistics > Content Filter
The following table describes the labels in this screen.
Table 59 Monitor > Security Statistics > Content Filter
LABEL
DESCRIPTION
General Settings
Collect Statistics
Select this check box to have the Zyxel Device collect content filtering statistics.
The collection starting time displays after you click
Apply
. All of the statistics in this
screen are for the time period starting at the time displayed here. The format is year,
month, day and hour, minute, second. All of the statistics are erased if you restart the
Zyxel Device or click
Flush Data
. Collecting starts over and a new collection start time
displays.
Apply
Click
Apply
to save your changes back to the Zyxel Device.
Reset
Click
Reset
to return the screen to its last-saved settings.
Refresh
Click this button to update the report display.
Flush Data
Click this button to discard all of the screen’s statistics and update the report display.
Web Request Statistics
Total Submit File
This field displays the number of web pages that the Zyxel Device’s content filter feature
has checked.
Blocked
This is the number of web pages that the Zyxel Device blocked access.
Warned
This is the number of web pages for which the Zyxel Device displayed a warning
message to the access requesters.
Passed
This is the number of web pages to which the Zyxel Device allowed access.
Category Hit Summary
Managed Web Pages
This is the number of requested web pages that the Zyxel Device’s content filtering
service identified as belonging to a category that was selected to be managed.
Block Hit Summary


