Chapter 6 Monitor
ZyWALL ATP Series User’s Guide
171
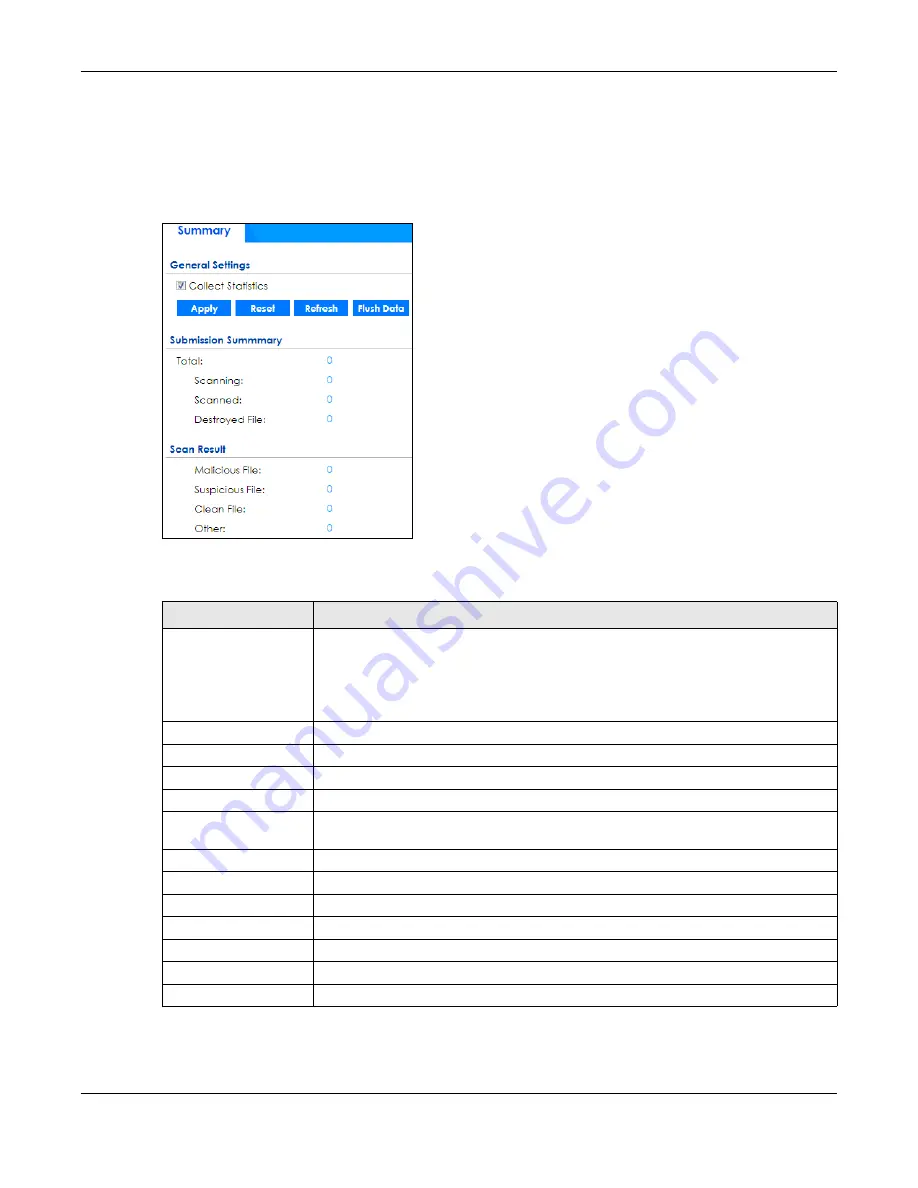
6.34 The Sandboxing Screen
Click
Monitor > Security Statistics > Sandboxing
to display the following screen. This screen displays
sandboxing statistics.
Figure 141
Monitor > Security Statistics > Sandboxing
The following table describes the labels in this screen.
Table 66 Monitor > Security Statistics > Sandboxing
LABEL
DESCRIPTION
Collect Statistics
Select this check box to have the Zyxel Device collect sandboxing statistics.
The collection starting time displays after you click
Apply
. All of the statistics in this screen
are for the time period starting at the time displayed here. The format is year, month, day
and hour, minute, second. All of the statistics are erased if you restart the Zyxel Device or
click
Flush Data
. Collecting starts over and a new collection start time displays.
Apply
Click
Apply
to save your changes back to the Zyxel Device.
Reset
Click
Reset
to return the screen to its last-saved settings.
Refresh
Click this button to update the report display.
Flush Data
Click this button to discard all of the screen’s statistics and update the report display.
Total
This field displays the total number of files that the Zyxel Device sent to a cloud server for
analysis.
Scanning
This field displays the total number of files that the Zyxel Device is still scanning.
Scanned
This field displays the total number of files that have been scanned.
Destroyed Files
This shows the number of files that have been destroyed.
Malicious Files
This shows the number of malicious files that have been detected.
Suspicious Files
This shows the number of suspicious files that have been detected.
Safe File
This shows the number of clean files that have been detected.
Other
This shows the number of internal and external networks errors.


