Chapter 6 Dashboard
UAG4100 User’s Guide
69
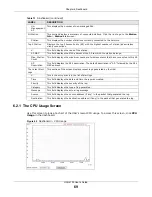
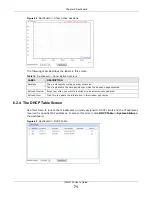
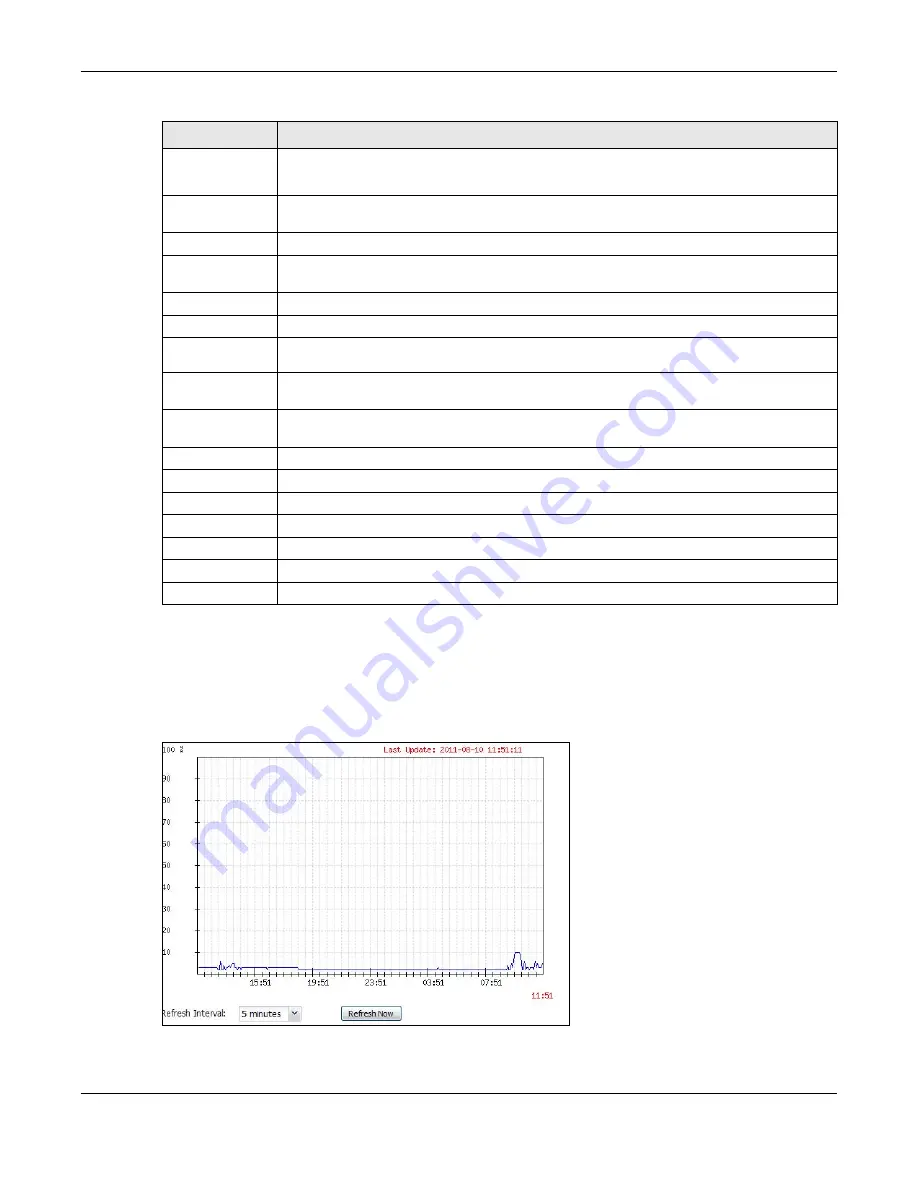
6.2.1 The CPU Usage Screen
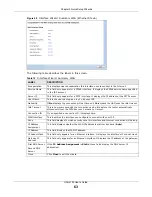
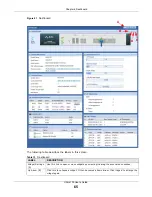
Use this screen to look at a chart of the UAG’s recent CPU usage. To access this screen, click
CPU
Usage
in the dashboard.
Figure 42
Dashboard > CPU Usage
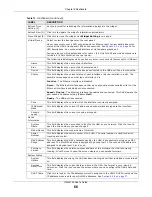
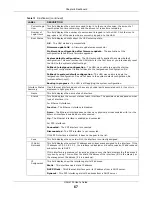
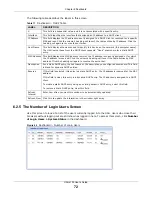
Un-
Management
AP
This displays the number of non-managed APs.
All Station
This section displays a summary of connected stations. Click the link to go to the
Station
Info
>
Station List
screen.
Station
This displays the number of stations currently connected to the network.
Top 5 Station
Displays the top 5 Access Points (AP) with the highest number of station (aka wireless
client) connections.
#
This field displays the rank of the station.
AP MAC
This field displays the MAC address of the AP to which the station belongs.
Max. Station
Count
This field displays the maximum number of wireless clients that have connected to this AP.
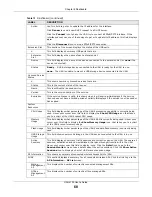
AP
Description
This field displays the AP’s description. The default description is “AP-” followed by the AP’s
MAC address.
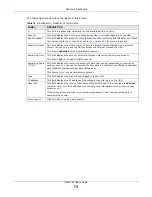
The Latest Alert
Logs
This section of the screen displays recent logs generated by the UAG.
#
This is the entry’s rank in the list of alert logs.
Time
This field displays the date and time the log was created.
Priority
This field displays the severity of the log.
Category
This field displays the type of log generated.
Message
This field displays the actual log message.
Source
This field displays the source address (if any) in the packet that generated the log.
Destination
This field displays the destination address (if any) in the packet that generated the log.
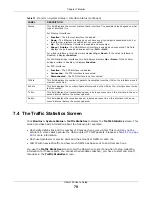
Table 13
Dashboard (continued)
LABEL
DESCRIPTION

