Chapter 7 Monitor
ZyWALL USG Series User’s Guide
200
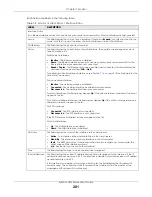
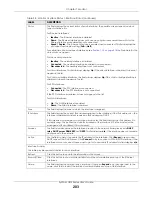
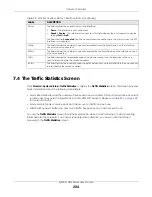
7.3 Interface Status Screen
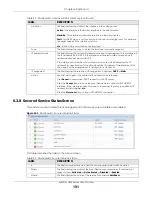
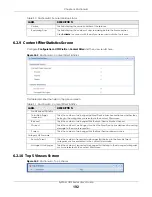
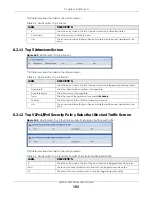
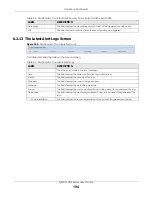
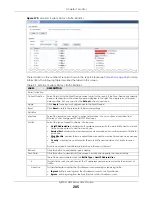
This screen lists all of the Zyxel Device’s interfaces and gives packet statistics for them. Click
Monitor >
System Status > Interface Status
to access this screen.
Figure 169
Monitor > System Status > Interface Status
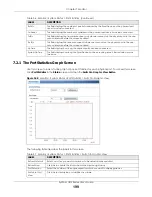
bps
The y-axis represents the speed of transmission or reception.
time
The x-axis shows the time period over which the transmission or reception occurred
TX
This line represents traffic transmitted from the Zyxel Device on the physical port since it was last
connected.
RX
This line represents the traffic received by the Zyxel Device on the physical port since it was last
connected.
Last Update
This field displays the date and time the information in the window was last updated.
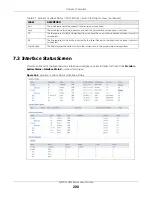
Table 37 Monitor > System Status > Port Statistics > Switch to Graphic View (continued)
LABEL
DESCRIPTION
Summary of Contents for USG110
Page 27: ...27 PART I User s Guide ...
Page 195: ...195 PART II Technical Reference ...
Page 309: ...Chapter 10 Interfaces ZyWALL USG Series User s Guide 309 ...
Page 313: ...Chapter 10 Interfaces ZyWALL USG Series User s Guide 313 ...
Page 358: ...Chapter 10 Interfaces ZyWALL USG Series User s Guide 358 ...
Page 373: ...Chapter 10 Interfaces ZyWALL USG Series User s Guide 373 ...


