background image

Operator manual

Simrad ES70

Fish finding echo sounder

T E C H N O L O G Y F O R S U S T A I N A B L E F I S H E R I E S

www.simrad.com

Summary of Contents for ES70 - DOWNLOAD AND INSTALLATION REV B

Page 1: ...Operator manual Simrad ES70 Fish finding echo sounder T E C H N O L O G Y F O R S U S T A I N A B L E F I S H E R I E S www simrad com ...

Page 2: ......

Page 3: ...vides you with the basic information required to operate the Simrad ES70 For a more detailed description of the operation and functionality including menus and all parameters refer to the Simrad ES70 Reference manual 343539 B 17 12 2010 Kongsberg Maritime AS ...

Page 4: ...written approval from Kongsberg Maritime AS Disclaimer Kongsberg Maritime AS endeavours to ensure that all information in this document is correct and fairly stated but does not accept liability for any errors or omissions Warning The equipment to which this manual applies must only be used for the purpose for which it was designed Improper use or maintenance may cause damage to the equipment and ...

Page 5: ...ED 20 Power On Off procedures 20 Power on 20 Power off 21 Using the trackball 22 Starting normal operation 23 How to select menu language 23 How to choose operational mode 24 How to check the transceiver and transducer settings 24 How to check the bottom detector settings 25 How to check the colour scale settings 26 How to check the size distribution and fish position settings 27 How to check the ...

Page 6: ...Colour Scale information pane 60 Size Distribution information pane 62 Fish Position information pane 64 Echo Position information pane 65 Zoom information pane 65 History information pane 66 Taskbar 67 Screen captures 69 OPERATIONAL PROCEDURES 70 User settings 71 How to save the current user settings 71 How to use previously saved settings 71 How to reset the ES70 to factory default parameters 72...

Page 7: ...ottom contour 87 Ranges 88 How to choose the start depth 88 How to choose an automatic start depth 89 How to choose the vertical range 89 Bottom detection 90 How to define maximum and minimum depth 90 How to adjust the bottom detection to find flatfish 91 How to adjust the bottom detection to find seagrass 92 Size distribution biomass and fish density 92 How to monitor the fish size distribution 9...

Page 8: ...ut biomass 108 About TVG gain 109 About dynamic range and display presentation 111 About output power 112 About pulse duration 113 About bottom slopes 115 About range selection 117 Upper echogram Pelagic or surface related 118 Lower echogram Bottom related bottom expansion 118 6 343539 B ...

Page 9: ... as soon as you have familiarized yourself with the menu system and the way you change parameters The ES70 comprises the following main parts A colour display A computer One or more transceiver units One or more transducers This manual will focus on the operational procedures and some theory For additional details see the Simrad ES70 Reference manual and the context sensitive on line help Click He...

Page 10: ...mrad ES70 Quick start guide 354205 Simrad ES70 Operator manual 343539 Simrad ES70 Reference manual 338106 Simrad ES70 Installation manual 343522 Español Simrad ES70 Guiá rápida de inicia 354319 Simrad ES70 Manual de Usuario 351291 Simrad ES70 Manual de Referencia 347237 Norsk Simrad ES70 Oppstartsguide 353233 Simrad ES70 Operatørmanual 353233 8 343539 B ...

Page 11: ...mputer You may switch of the transceiver too When docking your vessel It is very important that no one tries to use the ES70 when the vessel is in dry dock If the transducer is activated when out of water it may be damaged beyond repair To ensure that this can not happen remove the power supply to the either the computer or the transceiver or both You may also remove the circuit breakers on the AC...

Page 12: ...computer switch you may damage the software application and the interface parameters to external devices System description The Simrad ES70 is designed for the professional fishery community implementing the latest innovations Echo sounders ranging from relatively low cost single beam to large multi frequency systems containing several split beam channels can be realised The Simrad ES70 comprises ...

Page 13: ... B Processor Unit C General Purpose Transceiver GPT D Transducer Figure 2 System diagram with two General Purpose Transceivers GPT A B C D PWR MENU Transducer 5V 12V 12V HV1 HV2 TX RX Fuse 10A 115 230 V AC Fuse 2A S1 S2 12 VDC Auxiliary Ethernet General Purpose Transceiver DSP 6X IO POWER Ethernet Transducer 5V 12V 12V HV1 HV2 TX RX Fuse 10A 115 230 V AC Fuse 2A S1 S2 12 VDC Auxiliary Ethernet Gen...

Page 14: ...ish to take advantage of the audible alarms offered the computer must be installed in such manner that the built in loudspeaker can be heard As an alternative an external powered loudspeaker can be connected Note The ES70 Marine Computer does not contain any fans It will be very warm even during normal operation Any commercial computer can also be used with the Simrad system provided that the comp...

Page 15: ...up to maximum 70 meters If a longer cable is required cut it in half and insert an Ethernet switch half way to provide buffer amplification If more than one transceiver is used a small Ethernet switch is required to connect the General Purpose Transceivers to the Processor Unit External power supply In order to avoid electrical noise certain GPT configurations are supplied with an external power s...

Page 16: ...al dealer or one of our support departments Norway Main office Address Strandpromenaden 50 3190 Horten Norway Telephone 47 33 03 40 00 Telefax 47 33 04 29 87 E mail address simrad support simrad com Website http www simrad no Spain Address Poligono Partida Torres 38 03570 Villajoyosa Spain Telephone 34 966 810 149 Telefax 34 966 852 304 E mail address simrad spain simrad com Website http www simra...

Page 17: ...on and installation of the transducer s and the various interface parameters Note In order to install the Simrad ES70 you must refer to the Simrad ES70 Installation manual 1 Install the various hardware units transceiver s computer s and transducer s as described in the Simrad ES70 Installation manual 2 Connect all necessary cables between the hardware units a Connect the transducer s to the trans...

Page 18: ...on 4 Allow the installation program to run Follow the instructions provided 5 Once the installation has been completed double click the program icon on the desktop to start the application 6 If you use Windows 7 operating system a Observe that Windows 7 Firewall will open a dialog requesting information about the network Select Public and click Allow access b The operating system may also open oth...

Page 19: ...ense dialog 5 Contact your dealer to order the software license Your dealer will need the following information from you to place the order Vessel name and call sign Vessel type trawler purse seiner etc Vessel owner s name address and contact information Serial number on all transceivers Hardware ID 6 When the software license is returned to you start the ES70 open the Software License dialog and ...

Page 20: ...dress 157 237 14 12 Subnet mask 255 255 0 0 f Click OK to save the settings g Exit all dialogs 2 On the computer start the ES70 program 3 Set up the transceiver s and transducer s Each transceiver contains one or more frequency channels This phrase is used to identify the combination of a transceiver transducers and the frequencies offered Split beam transceivers contain only one channel each The ...

Page 21: ...hannel that is available and choose the correct transducer in the spin box Note This is a critical task You must ensure that the correct transducer is selected If you connect the transceiver to a transducer that can not handle the power rating it may be damaged beyond repair f Observe that the status for the relevant frequency channels changes to Installed g Click OK to save the current settings a...

Page 22: ...ration on page 23 Echo sounder presentations on page 33 Title Bar on page 35 Taskbar on page 36 The menu system on page 37 Power On Off procedures Observe these procedures to switch the Simrad ES70 on and off Note Before you power up the ES70 for the very first time observe the procedures in chapter Installation on page 15 Make sure that you have sufficient water below the hull before you power up...

Page 23: ...d side of the ES70 presentation b Click the Operation icon under the Main menu to open the Operation sub menu Operation menu on page 104 c Click the Operation button and select Normal 7 On the Ping button click the symbol on the right hand side to start pinging 8 Observe that the ES70 starts The ES70 starts up using the same operational parameters as the last time you used it If these parameters a...

Page 24: ...m to switch it off manually 4 Switch off the display 5 Switch off the transceiver s Using the trackball Figure 5 Typical trackball C D A B CD010216A All ES70 functions are controlled with the trackball The ball controls the movements of the cursor and the buttons are used to click on buttons and select parameters A Control wheel B Trackball C Right mouse button D Left mouse button This trackball i...

Page 25: ...ge 23 How to choose operational mode on page 24 How to check the transceiver and transducer settings on page 24 How to check the bottom detector settings on page 25 How to check the colour scale settings on page 26 How to check the size distribution and fish position settings on page 27 How to check the echogram settings on page 28 How to check the range settings on page 30 How to save the current...

Page 26: ...nsceiver and transducer settings This procedure explains how you can verify that the transceiver and transducer settings are correct 1 Observe that the currently connected transducer s are shown as tabs on the Taskbar Each transducer name also identifies the operational frequency 2 Click the Setup icon under the Main menu to open the Setup menu Setup menu on page 106 3 Click Installation to open t...

Page 27: ... c Set Power to maximum d Check that the Depth value is set correctly This is the depth of the transducer face relative to the water surface A positive value of for example 5 meters means that the transducer is located 5 meters below the sea surface For accurate depth readings this Depth value must be set up correctly 9 Click OK to save the current settings and close the dialog How to check the bo...

Page 28: ...n on the Title Bar to open the Colour Scale information pane Colour Scale information pane on page 60 2 Observe that the current colour scale is shown By default you have 64 or 12 colours available to present the echograms and a selection of palettes The colour scale can be retrieved any time by clicking the Colour Scale icon on the Title Bar Which colour scale to use is defined in the Colour Setu...

Page 29: ...available if you use a split beam echo sounder system 1 Click the Size Distribution icon on the Title Bar to open the Size Distribution information pane The Size Distribution information pane shows a histogram of the single fish echoes detected The calculation is based on the parameters you have selected in the Calculation Interval dialog time ping or a chosen part of the current view It thus prov...

Page 30: ...n pane on page 64 5 Click the Echo Position icon on the Title Bar to open the Echo Position information pane The Echo Position pane shows the position within the beam of the detected single echoes for the current ping largest circles and the three previous ping smaller circles The colours indicate the echo strength This is basically the same view as the Fish Position however the echoes are here vi...

Page 31: ...wn for pings having a successful bottom detection The biomass calculation is made in the same way as for Surface echograms c Pelagic This echogram is nearly identical to the Surface echogram However the biomass is calculated in a different manner The biomass calculations are not restricted by the bottom detection This means that the bottom echo will be included in calculations if it appears within...

Page 32: ...se the vertical scale of the echogram Finally the Lines tab offers time or distance markers and you can enable annotations 9 Click Bottom line and White line to enable these Observe the changes on the echogram 10 Click the Echogram tab The Echogram tab in the Echogram dialog allows you to select which TVG curve to use for the echogram You can choose from several standard curves or make your own Th...

Page 33: ...20 meters The echogram will now show the area from the sea surface and down to 20 meters below the bottom The bottom contour is easily detected when the depth changes Example 3 Start Range in a surface echogram In a surface echogram set the Start Range value to 10 meters This will make the echogram start from 10 meters below the sea surface provided that the transducer offset has been defined Set ...

Page 34: ...ght hand side of the ES70 presentation 2 Click the User Settings button to open the User Settings dialog 3 In the User Setting dialog click the Save Current Setting button 4 In the Setting dialog click OK to accept the suggested name 5 You can also choose a different name If you have a keyboard connected to the ES70 computer you can click in the text field remove the suggestion and enter any name ...

Page 35: ...ific functions B Echogram s One or more Echogram is displayed using the largest portion of the screen The presentation layout is controlled by the function buttons on the Status bar You can display individual echograms for each frequency in use or you can lay out the presentation of all frequencies either horizontally or vertically Additional information panes may be selected on the Title Bar usin...

Page 36: ...nu D Taskbar The Taskbar stretches across the entire presentation width at the bottom of the display On the left side dedicated function buttons allows you to control the presentation layout E Replay bar The Replay bar controls the playback when in Replay mode It is only visible in this mode For a more detailed description of the echogram presentations and the display views see chapter Display vie...

Page 37: ... views Title Bar on page 43 Figure 7 Title Bar The following information elements are placed on the Title Bar a Logo and product name This element identifies the manufacturer and the product Logo and product name on page 43 b Operation buttons These buttons are used to control basic operational functions Operation buttons on page 44 c Information panes The icons are used to open and close dedicate...

Page 38: ... contains tabs to control the echogram presentations It also provides time and date information Figure 8 Taskbar A Echogram browser B Presentation format C Transducer echogram presentation D Date E Time For more information see the Display views chapter Taskbar on page 67 36 343539 B ...

Page 39: ...e visual aspects of the system such as parameters related to the display presentation 4 The Setup menu allows you to control the configuration of the signal processing as well as system installation and maintenance and the interfaces to peripheral devices 5 The Active menu has its content linked to the current active item view or object Use it to access special features available for the selected ...

Page 40: ...ove the cursor horizontally left to decrease the parameter value or right to increase it 4 Release the mouse button when the requested value is shown How to select a numerical parameter by means of the scroll wheel 1 Place the cursor on the middle of the button 2 Spin the scroll wheel in either direction to increase or decrease the parameter value 3 Release the scroll wheel when the requested valu...

Page 41: ...y closed 2 Whenever applicable you can also access the sub menu by clicking the left and right side of the button but this method will not show you the menu choices a Click on the left side of the button to select a lower sub menu choice b Click on the right side of the button to select a higher sub menu choice How to select parameters using a dialog 1 Click anywhere on the button to open a separa...

Page 42: ...user interface elements have been created in close cooperation with designers and users This chapter provides a brief overview of the information displayed by the Simrad ES70 and how the information is organised Topics Display organisation on page 41 Title Bar on page 43 Replay bar on page 49 Menu system on page 50 Echograms on page 50 Information panes on page 58 Taskbar on page 67 Screen capture...

Page 43: ...el transceiver transducer combination surface related and bottom related If you have more than one frequency channels the echograms for each frequency can be presented horizontally with one over the other or next to each other This is controlled by tabs on the Taskbar D Echograms on page 50 You can modify the size of the echograms by moving the boundary lines between the echograms Click on a bound...

Page 44: ...w the Title Bar The Replay bar allows you to retrieve saved files and to control the playback Replay bar on page 49 F Sub menus Four sub menus may be opened from the four icons in the bottom of the Main menu Menu system on page 50 G Information panes You can choose from several Information panes to provide you with additional data These panes are selected from the buttons on the Title Bar The pane...

Page 45: ...capture and to start and stop a recording D Information panes Click any of these buttons to open and close an information pane E Navigation These are not buttons but information fields providing current data related to the vessel movements F Function These buttons are used to control basic system functions Alarm Click this button to open the Messages dialog This button will flash to indicate that ...

Page 46: ...to start and stop recording The recording function is set up using the parameters available on the Record button on the Operation menu Remember to stop the recording when you have finished the job If you forget your harddisk will soon be full Note Raw data files will normally become very large If you wish to record large amounts of echogram raw data make sure that you have enough space on you hard...

Page 47: ...ation pane you must obtain a software licence Biomass information pane on page 59 Bottom Hardness Click this icon to open and close the Bottom Hardness information pane This pane provides the bottom hardness in the current echogram Please note that bottom hardness is an optional function In order to activate the Hardness line and the Bottom Hardness information pane you must obtain a licence Botto...

Page 48: ...formation is also provided in the Fish Position information pane but the beam is there seen from above The Echo Position information pane is only available if your ES70 is equipped with one or more split beam transceivers Echo Position information pane on page 65 Zoom Click this button to open and close the Zoom information pane This pane allows you to zoom in on a selected area of the current ech...

Page 49: ... communication with the external GPS system heading sensor or gyro compass is set up using the Navigation button on the Setup menu Vessel speed Provided that a GPS or speed log system is connected to the ES70 this field on the Title Bar will display the vessel s current speed The communication with the external GPS system or speed sensor is set up using the Navigation button on the Setup menu Wate...

Page 50: ...ogs in the ES70 Click any Help button in the top right corner of any dialog to open the help system Minimize button Click this button to minimize the ES70 display presentation This is an operating system function To restore the presentation to its previous size click the ES70 button on the operating system s taskbar Resize button Click this button to change the size of the ES70 display presentatio...

Page 51: ...k this button to start the playback or to pause it C Replay speed Click this slider to adjust the replay speed D File select This button shows which file you are currently playing Click the button to open the Replay dialog E Progress This bar shows you the replay progress of the current file If you have chosen to loop the replay file s the green indicators will start from left every time the start...

Page 52: ...the menu icons under the Main menu One click on an icon opens the sub menu the next click closes it 1 The Main menu provides the parameters most frequently used during normal operation 2 The Operation menu controls the main operational parameters 3 The Display menu controls the visual aspects of the system such as parameters related to the display presentation 4 The Setup menu allows you to contro...

Page 53: ...m left side of the echogram In the bottom right corner the ping time is the same as current This information can be changed using the options on the Horizontal Axis tab in the Echogram dialog F This is the lower end of the depth range It is normally a few meters below the bottom contour depending on the chosen range Example 5 Start Range in a surface related echogram In a surface echogram set the ...

Page 54: ... range from the start depth above the bottom and down to some distance below the actual bottom is defined with the Range button on the Main menu Example 6 Start Range and Range in bottom related echogram In a bottom echogram set the Start Range value to 5 meters This will make the echogram start from 5 meters above the bottom Set Range to the 5 meters plus 10 15 meters The echogram will now show t...

Page 55: ...his information is required for the trawl echogram to be generated Without the depth of the headrope the echogram will appear like a standard pelagic echogram controlled by the Range and Start Range parameters The distance from the headrope to the footrope trawl opening can be manually set in the Trawl dialog This is useful for trawl sensor systems not measuring the trawl opening or when the measu...

Page 56: ...ng a bottom line This is done in the Echogram dialog on the Active menu The bottom line appears as a black line and follows the bottom contour Related topics How to establish horizontal markers on page 84 White line Figure 17 White line example The bottom contour may also be enhanced by adding a white line The white line is an extra thick white line that is added to just below the bottom The white...

Page 57: ...ion pane also provides the current reflectivity measured in dB Please note that bottom hardness is an optional function In order to activate the Hardness line and the Bottom Hardness information pane you must obtain a licence The Hardness line can not be used simultaneously with the white line The Hardness line is enabled in the Echogram dialog Related topics Bottom Hardness information pane on pa...

Page 58: ... is enabled in the Echogram dialog on the Active menu Related topics How to establish horizontal markers on page 84 Range other lines Figure 20 Range Other lines example This feature is used when you set up your ES70 with both a surface related and bottom related echogram shown simultaneously When enabled two horizontal lines in the surface echogram indicate the range selected in the bottom echogr...

Page 59: ...s line is enabled in the Echogram dialog You can change the scale of the curve to fit the vertical space available on the echogram Related topics Biomass information pane on page 59 How to establish horizontal markers on page 84 Range scales Range scales in the echogram can be enabled in the Echogram dialog Related topics How to establish horizontal markers on page 84 Vertical ticks When enabled i...

Page 60: ... consult your local dealer About information panes You can change the size of the information pane to suit your preferences and you can move it within the echogram presentation it is valid for To change its size click on the shaded area in the bottom right corner hold the mouse button depressed and drag to requested size To move an information pane just click inside it hold the mouse button depres...

Page 61: ...on pane displays the current biomass The calculation is based on the selection you have made in the Calculation Interval dialog time ping or a chosen part of the current view Only the biomass calculated for the current transducer and frequency is shown The Tool button opens the Calculation Interval dialog This dialog is also available from the Setup menu Note that biomass is an optional function I...

Page 62: ...and the Bottom Hardness information pane you must obtain a licence The vertical line in the hardness colour scale positions the current ping The hardness of the current ping is also shown with the numerical value The bottom hardness can also be indicated by enabling the bottom hardness line in the Echogram dialog This line uses the same colour coding as the information pane but places this as a th...

Page 63: ...t the cursor changes shape to a dual arrow line 3 Click on the left edge of the colour scale keep the mouse button depressed and drag the edge towards right 4 Observe that the weakest colours are removed from the colour scale and thus also the weakest echoes from the echogram presentation 5 Release the mouse button 6 In order to restore the weakest colours click on the left edge of the current col...

Page 64: ...y used It means Target Strength and this is a measure of how strong echo the individual fishes in the current echogram generate The echo strength indicates the size of the fishes The Size Distribution information pane thus provides a mathematical estimate of the sizes of all the chosen fish species in the echogram The target strength from a fish varies from specie to specie To change the fish spec...

Page 65: ...into consideration other bottom echoes than fish Zoom This histogram is created based on fish echoes from the currently zoomed area 3 Mean value The large number above each histogram is the mean value from the tallest bar The unit reflects the mode chosen in the Size Distribution dialog To change the settings in the histogram click Size Distribution on the Active menu The Size Distribution dialog ...

Page 66: ...single echoes for the current ping largest circles and the three previous ping smaller circles The view is from above The colours indicate the echo strength Note The Fish Position information pane is only available if your ES70 is equipped with one or more split beam transceivers Parameters 1 Source This is the source of the fish position information In the example the surface echogram is used to ...

Page 67: ...ormation pane is only available if your ES70 is equipped with one or more split beam transceivers Parameters 1 Source This is the source of the echo position information In the example the surface echogram is used to determine the latest echo positions Zoom information pane Figure 30 Zoom information pane To open this information pane click the Zoom icon on the Title Bar The Zoom information pane ...

Page 68: ...k the History icon on the Title Bar to enable this function The History information pane does not use the same presentation method as the other panes The function allows you to view previously recorded echogram sequences In order to do this the current active echogram is split in two and the left side is used to display the recorded history This function is used to store echograms on bitmap format...

Page 69: ...the echogram presentations It also provides time and date information Figure 33 Taskbar A Echogram browser B Presentation format C Transducer echogram presentation D Date E Time The Taskbar contains the following information A Screen Captures This tab hides the current live echograms from view and allows you to see the echogram images you have previously saved using the Screen Capture button on th...

Page 70: ...an example If only one transducer is in use you will have only one echogram These tabs are then not shown ES38 This tab allocates the echo sounder presentation to only show the echogram from this transducer ES120 This tab allocates the echo sounder presentation to only show the echogram from this transducer D Date This field on the taskbar presents the current date Note that during replay the date...

Page 71: ...To save an echogram click the Screen Capture button on the Title Bar To view the recorded image click Screen Capture on the Taskbar to open the image browser Click Open Image Folder to open the operating system folder containing the files This folder offers operating system functionality to provide renaming copying printing and deleting files 343539 B 69 ...

Page 72: ...nu choices shown in dark colours are not available for the current operation or operational mode Are there any procedures missing Are you performing an operation that we have not explained Write an e mail to simrad support simrad com and ask We may then include the procedure in the next version of this manual Topics User settings on page 71 User preferences on page 73 Save and recall echograms on ...

Page 73: ...S70 operational parameters for future use 1 Observe the Main menu It is normally located on the right hand side of the ES70 presentation 2 Click the User Settings button to open the User Settings dialog 3 In the User Setting dialog click the Save Current Setting button 4 In the Setting dialog click OK to accept the suggested name 5 You can also choose a different name If you have a keyboard connec...

Page 74: ...ent settings and close the dialog How to reset the ES70 to factory default parameters If the current settings are unreliable or you simply wish to reset the ES70 to a known set of parameters choose the factory setting provided 1 Observe the Main menu It is normally located on the right hand side of the ES70 presentation 2 Click the User Settings button to open the User Settings dialog 3 In the Use...

Page 75: ... and characters on the button to leaf through the list of available languages 4 Click once on the language you wish to use 5 Observe that the sub menu is closed and that all text in the menu buttons change to the selected language The context sensitive on line help file may also be available in your language To change the language in the on line help restart the ES70 If your language is not offere...

Page 76: ...educed from 100 to 0 in steps of 10 1 Click the Display icon under the Main menu to open the Display menu Display menu on page 105 2 Click either side of the Screen Brightness button to make the adjustment How to select measurement units This procedure explains how to change the measurement units in the ES70 presentations Use the Units dialog to set up the various units of measurements you wish to...

Page 77: ...continuously When the file is full it will start to overwrite the oldest data thus creating a ring buffer To play back the history file click the History button on the Title Bar This procedure explains how to save a single echogram image as a bitmap file 1 Observe the Screen Capture button on the Title Bar 2 Click the button to save the current display presentation The screen capture is saved on t...

Page 78: ...n external storage device 1 Click the Operation icon under the Main menu to open the Operation sub menu Operation menu on page 104 2 Click Record to open the sub menu 3 Click File Output to open the File Output dialog 4 In the File Output dialog a On the Directory tab define the file output directory These are the default directories for raw data Windows XP c documents and settings all users appli...

Page 79: ...s All the currently saved echogram images are shown as miniatures 2 Double click on the miniature you wish to enlarge 3 Click Return To Browser to close the image How to play back echogram sequences raw data This procedure explains how you can play back recall echogram sequences raw data 1 Click the Operation icon under the Main menu to open the Operation sub menu Operation menu on page 104 2 Clic...

Page 80: ... the Microsoft XP and or Microsoft 7 operating system utilities for file handling 1 On the Status Bar click the Screen Captures tab to open the browser 2 In the browser click Open Image Folder to open an operating system folder By default the folder name is Windows XP c documents and settings All Users Application data Simrad ES70 ScreenDumps Windows 7 c programdata Simrad ES70 ScreenDumps 3 Use t...

Page 81: ...e space available 1 Move the cursor to the border line between two fields Observe that the marker changes form it now appears as two parallel lines with arrows pointing out 2 Click on the left mouse button and keep it depressed 3 Move the mouse or roll the control wheel and observe that the border line moves 4 Release the mouse button when the border line has been moved to desired position How to ...

Page 82: ...e on the ES70 echograms 1 Click the Display icon under the Main menu to open the Display menu Display menu on page 105 2 Click Colour Setup to open the Colour Setup dialog 3 Select palette and echogram colours to suit your requirements 4 Click OK to save the current settings and close the dialog How to change the number of colours in the echogram By default you have 64 or 12 colours available to p...

Page 83: ... noise from the echograms on page 86 How to easier identify the bottom contour on page 87 Related topics About range selection on page 117 About dynamic range and display presentation on page 111 About bottom slopes on page 115 About TVG gain on page 109 How to change the ping rate The ping rate is the parameter that controls how often the echo sounder shall transmit acoustic energy a ping into th...

Page 84: ... with maximum speed The time between each ping is automatically determined by a number of parameters including the current depth the pulse duration and the chosen range 4 How to define a ping interval a Click Ping Mode and select Interval b Click Ping Interval and select the time in milliseconds between each ping 5 How to transmit single pings a Click Ping Mode and select Single Step b To transmit...

Page 85: ... bottom detection The biomass calculation is made in the same way as for Surface echograms c Pelagic This echogram is nearly identical to the Surface echogram However the biomass is calculated in a different manner The biomass calculations are not restricted by the bottom detection This means that the bottom echo will be included in calculations if it appears within the chosen range Example 9 Biom...

Page 86: ... Hardness line on page 55 Trawl line on page 55 Variable depth line on page 56 Range other lines on page 56 Biomass line on page 57 Range scales on page 57 Vertical ticks on page 57 Annotations on page 58 This procedure explains how you can enable one or more horizontal markers in the current echogram 1 Click the Active icon under the Main menu to open the Active menu Active menu on page 107 2 Cli...

Page 87: ...s tab observe the various vertical markers that can be enabled Note The annotations are controlled on the Annotation dialog but to place the annotations in the echogram you must enable them in the Echogram dialog 4 Enable the vertical markers you wish to see 5 Click OK to save the current settings and close the dialog How to select TVG gain in the Echogram dialog TVG means Time Varied Gain The who...

Page 88: ...bottom related echograms click Apply To All 5 Click OK to save the current settings and close the dialog How to remove interference and vessel s own noise from the echograms The Active sub menu offers a dedicated filter to remove interference and noise from your own vessel the Ping Ping Filter This procedure explains how to activate this filter The following filter options are provided a Off No fi...

Page 89: ... bottom contour The Echogram dialog allows you to enable a Bottom line or a White line to easier identify the bottom This procedure explains how to enable these features The marker lines enabled here are explained in section Echograms in chapter Display view Lines markers and annotations in the echograms on page 54 1 Click the Active icon under the Main menu to open the Active menu Active menu on ...

Page 90: ...u Example 10 Start Range in a surface related echogram In a surface echogram set the Start Range value to 0 meters This will make the echogram start from the sea surface provided that the transducer offset has been defined Set Range to the current depth plus 20 meters The echogram will now show the area from the sea surface and down to 20 meters below the bottom The bottom contour is easily detect...

Page 91: ...ved the bottom contour is still visible 1 Observe the Main menu It is normally located on the right hand side of the ES70 presentation 2 Observe the Start Range button 3 Click the middle of the button to open it 4 Click to enable Automatic Start Depth 5 Click the middle of the button to close it How to choose the vertical range The vertical range is controlled by the Range button on the Main menu ...

Page 92: ...aximum and minimum depth When you use the ES70 it is very important that it detects and locks on the correct depth Normally this will happen automatically However certain conditions such as noise or air under the hull or the appearance of large schools of fish may fool the sounder When the bottom is undetected you will read 0 00 meters depth In order to guide the ES70 to locate the correct depth y...

Page 93: ...epth within the minimum and maximum depths you have defined Do not exaggerate If you for example enter 5000 meters and the bottom track is lost the ES70 will search the entire depth for new bottom lock This will take a lot of time 5 Click OK to save the current settings and close the dialog How to adjust the bottom detection to find flatfish The ES70 provides the Bottom Backstep parameter in the B...

Page 94: ...tive menu click Bottom Detector to open the Bottom Detector dialog This dialog is used to define various parameters associated with the bottom detection These include the depth range where the ES70 searches for the bottom 3 Decrease the Bottom Backstep level to a lower value make it more negative A typical setting would be approximately 60 dB but you will need to experiment to find the best value ...

Page 95: ... the transparency of the information pane open the Display menu and click the Transparency button 4 Click on the histogram titles to see the information from the different echograms 5 To change the presentation parameters a Click the tool button in the top right corner of the information pane to open the Size Distribution dialog The dialog can also be opened from the Active menu b Make the necessa...

Page 96: ...Hz or 200 kHz echo sounder frequencies as the mackerel shows largest echo strength for these frequencies 1 Click the Setup icon under the Main menu to open the Setup menu Setup menu on page 106 2 Click Fish Select to open the Fish Select dialog 3 Make the necessary adjustments 4 Click OK to save the current settings and close the dialog How to monitor the current biomass The biomass is presented u...

Page 97: ...omass can be enabled or disabled and that you can define a scale for it 4 Make the necessary adjustments 5 Click OK to save the current settings and close the dialog Gain These procedures explain how you can adjust the gain in the ES70 This controls how powerful the echoes are shown in the echogram The ES70 uses two principles for gain signal amplification and time varied gain TVG Topics How to ad...

Page 98: ...ndependent of their depths The ES70 has a TVG range down to 15 000 meters which for all practical purposes is unlimited The ES70 does not have a TVG compensated receiver like most other echo sounders In the ES70 the TVG is made in software after the echoes from the receiver s have been converted to digital format In order to make this work the receiver must have very large dynamic range The TVG ca...

Page 99: ...n on page 113 How to choose passive mode In order to check how much noise the ES70 is receiving set it to passive mode This means that the ES70 is not transmitting sound pulses into the water it is only listening 1 Click the Operation icon under the Main menu to open the Operation sub menu Operation menu on page 104 2 Click Normal Operation to open the Normal Operation dialog This dialog is used t...

Page 100: ... the Operation sub menu Operation menu on page 104 2 Click Normal Operation to open the Normal Operation dialog This dialog is used to define various parameters associated with the transceiver These settings include transceiver mode the depth of the transducer surface the transmit power and the pulse duration Note that this dialog is not available in Replay mode 3 For the relevant transducer chann...

Page 101: ...define various parameters associated with the transceiver These settings include transceiver mode the depth of the transducer surface the transmit power and the pulse duration Note that this dialog is not available in Replay mode 3 For the relevant transducer channel set Pulse Length to requested value For general use we recommend that the pulse duration is set to Auto About pulse duration on page...

Page 102: ... a main menu a set of secondary menus and several menu buttons Some of the menu buttons open dialogs or miniature menus to provide additional parameters The text in the buttons can be changed to suit your preference using the Language button on the Display sub menu How to select menu language on page 73 1 The Main menu provides the parameters most frequently used during normal operation 2 The Oper...

Page 103: ...ues by means of the scroll wheel on the mouse or trackball You can enter parameter values from the keyboard if you have one You can select parameter value from the button s sub menu You can open a dedicated dialog How to select a numerical parameter using the buttons 1 Move the cursor to either side of the button and observe that the background colour changes a Click on the left side of the button...

Page 104: ...for the parameter the frame in the text field will be red You will then not be able to enter the value 3 Press the Enter key How to select a parameter using a sub menu 1 Click the middle section of the button to open a sub menu then click the requested parameter value The chosen value is applied and the sub menu is automatically closed 2 Whenever applicable you can also access the sub menu by clic...

Page 105: ...olumn the presentation shall start The value shown and selected is applied to the currently selected echogram type In a surface related echogram you can click Automatic Start Depth to allow the ES70 to select the start range automatically 4 The purpose of the Gain function is to adjust the echo level in the echogram presentations The bottom of the Main menu holds the icons for the sub menus Click ...

Page 106: ...to control how often the ES70 shall transmits its energy into the water 4 Use the Ping Interval function to choose the time in milliseconds between each transmission ping when Ping Mode is set to Interval 5 The purpose of the Normal Operation dialog is to provide an overview of the current transceiver parameters and to provide you with the ability to change them 6 The Record function allows you to...

Page 107: ...sparency function is to adjust how much you are able to see through the information panes 5 The purpose of the Language function is to select the language to be used on the menus 6 The purpose of the Layout dialog is to arrange the location of the echograms on the presentation or to temporarily hide any of them 7 The purpose of the Display Options dialog is to control the location of the menu and ...

Page 108: ...d the size distribution 5 The Navigation dialog controls how the ES70 receives information from external peripherals such as navigation and compass gyro systems 6 The Trawl dialog allows you to enter the main parameters related to the trawl Trawl information is used for display of upper and lower trawl line in the echogram All received speed data are stored to file when recording of raw data to fi...

Page 109: ...ed echoes 3 The Ping Ping Filter removes unwanted noise and echoes from the echogram presentation 4 The Bottom Gain setting controls the gain below the detected bottom depth 5 The Size Distribution dialog allows you to set up the parameters for the histogram presented in the Size Distribution information pane 6 The purpose of the Bottom Detector dialog is used to define the upper and lower depth l...

Page 110: ...ccess to the Biomass information pane This biomass value is an indicator to how much fish you currently have in the current echogram or in the zoomed area Every single fish will emit an echo and the sum of all these registered echoes are presented as a number Smaller organisms such as plankton will also emit echoes but these are so weak that they will hardly influence on the total biomass ES70 rec...

Page 111: ...culations and provide you with inaccurate information Related topics Biomass line on page 57 Biomass information pane on page 59 About TVG gain TVG means Time Varied Gain When TVG is used in an echo sounder we also some times refer to it as depth variable gain The purpose of the TVG functionality is to make all fishes appear with the same echo colour independent of their different depths In more t...

Page 112: ...choes than a school and this makes them more difficult to detect In the equation the character R means Range Figure 37 TVG principle CD010217 004 20 log R 40 log R A A The illustration shows how the gain close to the bottom B is larger than just below the transducer A The echoes from the fish close to the bottom will then be shown with the same strength colour as echoes from pelagic fish The left ...

Page 113: ...th Every colour 3 dB the represent a doubling of the echo strength With 12 colours in use this will be a 36 dB colour range from grey to brown Grey is used for the weakest echoes while the strongest echoes are brown All echoes stronger than brown will still be brown while echoes weaker than grey will not be shown With 64 colours in use each colour represents approximately 0 5 dB echo strength The ...

Page 114: ...y parameters about the transducer are then known by the echo sounder and the software in the sounder will ensure that you do not output too much power If you use a third party transducer you must manually check that the output power from the Simrad ES70 does not exceed the power rating Note If you send too much power into the transducer it will just like a loudspeaker be damaged beyond repair If t...

Page 115: ...than 1 atm the absolute pressure for a sound source at sea level will be less than zero during the rarefaction part of the cycle In using CW below 10 kHz this negative pressure or tension is the trigger for a sharply increased level of harmonic distortion and the issuance of broadband noise Any attempt to increase the sound pressure amplitude appreciably beyond the ambient pressure will cause not ...

Page 116: ...paration The left vessel uses a long pulse duration C As you can see this causes the echoes from the two fishes A and B to merge The right vessel uses a shorter pulse duration and the two fishes will then appear as two separate echoes on the echogram Thus short pulses will provide the best resolution and separation of individual fishes but the echo sounder is more sensitive to noise The speed of s...

Page 117: ...ects the bottom before the opposite edge One method for minimizing the bottom slopes phenomenon is to use a transducer with narrow beam or to increase the pulse duration Another way to minimize this phenomenon is to open the Bottom Detector dialog and then change the setting for Bottom Backstep This function can also be put to other use Figure 40 The Bottom Backstep principle 50 dB 70 dB 30 dB CD0...

Page 118: ... Bottom slopes The edge of the beam A hits the bottom first and starts to give an echo The bottom detector in the ES70 measures the strongest echo detects what it thinks is the bottom and starts the white line The area above the bottom detection B will be masked off and even though it may contain fish these will not be visible because the echo from the bottom is stronger than those from the fish T...

Page 119: ...to find flatfish on page 91 About range selection For every frequency channel you wish to present on the echo sounder display you are provided with two echograms Figure 42 Range selection A B C D CD010217E A Upper echogram surface related B Lower echogram bottom related C Scope view for upper echogram D Scope view for lower echogram Normally the upper echogram will show the entire depth range from...

Page 120: ...surface provided that the transducer offset has been defined Set Range to the current depth plus 20 meters The echogram will now show the area from the sea surface and down to 20 meters below the bottom The bottom contour is easily detected when the depth changes Example 17 Start Range in a surface echogram In a surface echogram set the Start Range value to 10 meters This will make the echogram st...

Page 121: ...t above the bottom In this echogram positive depth is below the bottom while negative depth is above Typical settings may be Range 15 m Start range 10 m This provides you with a 15 meters high phased area starting at 10 meters above the bottom to 5 meters below it Example 19 Start Range and Range in bottom related echogram In a bottom echogram set the Start Range value to 5 meters This will make t...

Page 122: ...isplay menu 105 Main menu 103 Operation menu 104 Setup menu 106 Choose language procedure 23 73 Colour threshold 26 61 80 Colour display description 12 Colour palette change 80 Colour scale change 80 check parameters 26 Colours presentation 26 61 80 Commands Active menu 107 Display menu 105 Main menu 103 Operation menu 104 Setup menu 106 Comments description 58 Computer mouse description 22 Contro...

Page 123: ...ion information pane 28 64 Fish size adjust 94 Fish species Size Distribution information pane 62 Flatfish detection 91 117 Flounder detection 91 Frequency channel installation 18 G Gain adjust 95 adjust TVG 96 Gain TVG description 109 General Purpose Transceiver GPT description 13 external power supply 13 Getting started 20 GPT description 13 H Hardness line description 55 Hierarchy menu 37 Histo...

Page 124: ... when docking 9 when the ES70 is not used 9 Information support 14 Information pane about 58 Biomass 59 Bottom hardness 60 change location 58 change size 58 depth 59 Echo position 27 Echo Position 28 65 Fish position 27 Fish Position 28 64 History 66 move 58 Size distribution 27 Size Distribution 27 62 Zoom 65 Initial start up procedure 17 Installation basic 15 procedures 15 software 16 Intensity ...

Page 125: ...ation 98 change screen brightness 74 change size of display fields 79 change TVG setting 85 change units 74 channel installation 18 check colour scale parameters 26 check echogram settings 28 check range parameters 30 check size distribution parameter 27 choose echogram type 83 choose language 23 73 choose operational mode 19 21 24 define maximum depth 90 define minimum depth 90 echogram channel i...

Page 126: ...d ES70 familiarization 9 introduction 9 Single echogram image recall 77 saving 75 Size distribution check parameters 27 show 93 Size Distribution information pane 27 62 SL Source level description 112 Slopes on the bottom description 115 Software installation 16 Software license obtain 16 Sole detection 91 Source Echo Position information pane 65 Fish Position information pane 64 Source level desc...

Page 127: ...erences procedures 73 User settings how to save 32 71 procedure 71 procedures 71 V Variable depth line description 56 Vertical marker lines 85 Vertical lines distance marker 57 time marker 57 Vertical presentation Taskbar 68 Vertical range check parameters 30 select 89 Vertical ticks description 57 Vessel noise reduce 86 View procedures 79 81 Visual presentation procedure 73 W White line descripti...

Page 128: ...ISBN 13 978 82 8066 118 0 2010 Kongsberg Maritime AS ...
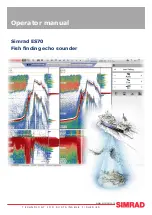
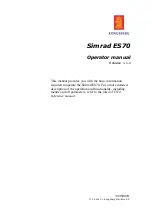
Reviews: