background image

Summary of Contents for KRONOS

Page 1: ......

Page 2: ...direct indirect special incidental or consequential damages resulting from any defects in this documentation 2022 Ultrafast Systems All rights reserved No part of this manual may be reproduced or copi...

Page 3: ...g the Excitation and Detection Wavelengths 15 7 4 Acquiring Data 18 8 Familiarizing Yourself with the Reference Samples 20 8 1 Base Catalysis of the cis trans Isomerization of Congo Red 20 8 2 Determi...

Page 4: ...mental Approach 32 11 Maintenance and Troubleshooting 33 11 1 Maintenance 33 11 2 Troubleshooting 34 12 Appendix 35 13 Warranty 36 Limitation of Warranty 36 14 Notice 37 14 1 Con fi dentiality Proprie...

Page 5: ...used for different experiments in Kronos The inset shows the full curve note the strong spike due to the fl ash lamp 19 Figure 9 Ground state absorption spectrum of Congo Red trans conf in 20 water e...

Page 6: ...positions with respect to each other Chemical Kinetics is one of the major divisions of Physical Chemistry and is basically the quantitative study of the rates and mechanisms of chemical reactions Che...

Page 7: ...when it is fi lled with liquid Always remove the cuvette before changing contents Never fi ll or re fi ll the cuvette when it is in the sample holder The optimal operation temperature of Kronos is at...

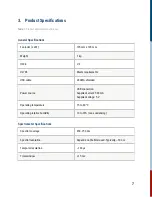
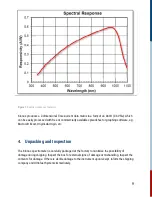
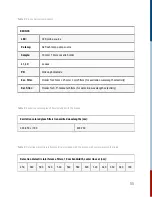
Page 8: ...uirements USB cable 28 AWG shielded Power source USB connection Supplied current 500 mA Supplied voltage 5 V Operating temperature 15 to 40 C Operating relative humidity 10 to 70 non condensing Spectr...

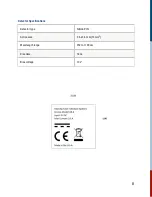
Page 9: ...Detector Speci fi cations Detector type Silicon PIN Active area 3 6 x 3 6 mm 13 mm2 Wavelength range 350 to 1100 nm Rise time 14 ns Bias voltage 10 V 8...

Page 10: ...phing software e g Microsoft Excel OriginLab Origin etc 4 Unpacking and Inspection The Kronos spectrometer is carefully packaged at the factory to minimize the possibility of damage during shipping In...

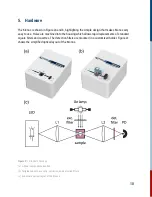
Page 11: ...h allows rapid replacements of standard square fi lters and cuvettes The detection fi lters are mounted in a customized holder Figure 2c shows the simpli fi ed optical layout of the Kronos Figure 2 3D...

Page 12: ...pump source Sample 10mm 10mm cuvette holder L1 L2 Lenses PD Silicon photodiode Exc fi lter Holder for 25mm 25mm 2mm fi lters for excitation wavelength selectivity Det fi lter Holder for 0 5 diameter f...

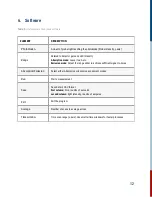
Page 13: ...djust the range slider to achieve su ffi cient signal to noise Absorption Emission Select either Absorption or Emission experiment modes Run Starts measurement Save Save data in CSV format fi rst colu...

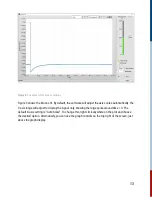
Page 14: ...atically the Y axis range will adjust to display the signal only showing the large spike around time 0 The default X axis setting is Auto Scale To change this right click anywhere on the plot and choo...

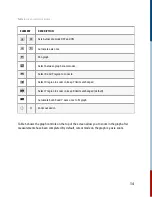
Page 15: ...ault cursor mode on the graph is y axis zoom ELEMENT DESCRIPTION Axis Autoscale mode OFF and ON Autoscale axis once Pan graph Select between graph zoom modes Select X and Y region to zoom in Select X...

Page 16: ...plays a value This will be I0 i e the baseline intensity before any pump induced changes In absorption mode during data acquisition the Kronos will wait for approximately 2 sec between fl ashes to all...

Page 17: ...Figure 4 Spectra of Kronos light sources a Xenon fl ash lamp for the pump b LED for the probe 16...

Page 18: ...dark blue fi lter 300 450 nm 700 nm has high transmittance around 350 nm and allows the Xe lamp to function as a UV blue light source If you wish to pump with a separate wavelength region e g 500 nm...

Page 19: ...5 nm Any incident light within this bandwidth has high transmittance Figure 6 Transmission spectrum of 600 nm detection dielectric interference fi lter 7 4 Acquiring Data Place a fi lled cuvette into...

Page 20: ...etic interference in the circuitry and is intrinsic to the equipment Since the temporal resolution of the Kronos is around 100 s you can safely reject the artifact and simply use the datapoints after...

Page 21: ...m of a solution of CR in its trans ground state in 20 water ethanol is shown in Figure 9 The dye absorbs strongly throughout the visible range and peaks at 510 nm Experiment Base catalysis of cis tran...

Page 22: ...ion and measure its rate on timescales that cannot be achieved by traditional mixing methods Using both acids and bases which function as catalysts this experiment allows the user to fi nd the bimolec...

Page 23: ...ht causing the detector to register a drop in transmission Then the excited cis state returns to the trans state ground state over many milliseconds Adjust averaging as desired then measure the other...

Page 24: ...ion for reference Piard Jonathan In fl uence of the Solvent on the Thermal Back Reaction of One Spiropyran Journal of Chemical Education 2014 91 2105 2111 6 NO BIPS undergoes a photochemical ring open...

Page 25: ...the kinetics of the back reaction will be measured for a range of temperatures in order to determine the activation energy E of the back reaction The literature reported value for E 62 5 kJ mol Figur...

Page 26: ...time pro fi le is shown in Figure 15 for a temperature of 55 C Also shown in this plot is the fi tted exponential decay function red line calculated using OriginLab Origin a commercial graphing softwa...

Page 27: ...Figure 15 Example decay and exponential fi t for 55 C measurement Figure 16 Actual data example of ln as a function of 1000 T 26...

Page 28: ...and the time window 9 3 Finding the Signal 1 Place the appropriate excitation and detection fi lters for your sample A prior UV vis absorption measurement would help determine which are appropriate 2...

Page 29: ...oscopists will choose different instruments to perform such experiments The most basic optical spectroscopic techniques are steady state measurements like absorption or fl uorescence spectroscopy Whil...

Page 30: ...ses or when the signal is maximum This manual uses the former de fi nition 10 2 Photochemistry Materials in this section have been adapted from A Qualitative Theory of Molecular Organic Photochemistry...

Page 31: ...or rate constant k is 8 This equation tells us that since the concentrations of the reactants decrease during the reaction then the rate but not the rate constant decreases with time elapsed Thus the...

Page 32: ...ction is fi rst order in A and overall fi rst order Orders higher than 2 fractional and zero orders are found in special cases These are not considered here because they are not relevant to Kronos NOT...

Page 33: ...product The blue line is drawn at the point of 50 reaction half of the initial concentration of A has been converted into B By inspection this occurs after an elapsed time of about 28 milliseconds Thi...

Page 34: ...cleaning them Always inspect the optics before and after cleaning them Use a magni fi cation device and a bright light to spot small defects and contaminants Clean optics in increasing level of conta...

Page 35: ...act your local representative or Ultrafast Systems if no light is detected 2 Try to average across more scans if the baseline intensity falls within the recommended range 3 Ensure the Range is set to...

Page 36: ...are In this window you can change the COM port and the default graphing unit from current to A Changing the latter will instruct the software to automatically perform calculations to convert the light...

Page 37: ...ity Repairs will be made and the instrument returned freight prepaid Repaired Products are warranted for the remainder of the original warranty period Limitation of Warranty The foregoing warranty sha...

Page 38: ...trade secrets of Ultrafast Systems and shall devote its best efforts to ensure that all its personnel protect the Ultrafast Systems Programs as trade secrets of Ultrafast Systems Customer shall not a...

Page 39: ......

Reviews: