Exercise 1, Part 2: Analyzing Performance and Memory
Hierarchy Impact
1-16
Getting Started with ADSP-BF537 EZ-KIT Lite
Rerunning the program shows a dramatic improvement in the program’s
performance, reflected by the output of the
printf()
statement. The
Sta-
tistical Profiling
window’s results are largely unchanged. Note that since
this is a statistical view, minor differences between the program runs are
expected.
Another way to tune the performance of a Blackfin processor is to place
key algorithms into internal memory. In this program,
bubble_sort()
is
the “key algorithm” in that it consumes the majority of the Blackfin’s pro-
cessing power. You can demonstrate the effect of placing the key
algorithm in internal memory by first “undoing” the cache set-up and
then placing the
bubble_sort()
function into L1 internal memory:
1. In the
Project
–>
Project Options
, navigate to the
Startup Code
Settings
–>
Cache and Memory Protection
page and change
Instruction cache memory
to
Disable cache and disable memory
protection
.
2. In the
sorts.c
file, go to the declaration of
bubble_sort()
and add
the section qualifier to place this function (and this function only)
into internal L1 memory:
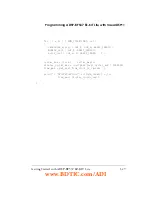
section("L1_code") void bubble_sort(int *v,
unsigned int length)
3. Build and run your program to completion. Now observe that the
overall performance is better than the first, non-cached run, but
not as good as the cached run because a significant portion of the
program still runs from external memory without the benefit of a
cache.
The statistical profile shows an interesting effect of the change: the
bubble_sort()
function no longer uses the largest percentage of the pro-
cessor time—
quick_sort()
is now the most time-consuming portion of
the application (
www.BDTIC.com/ADI


