13
revolution
Revolution Education Ltd. Web: www.picaxe.co.uk
Version 2.0 12/10
AXE110.PMD
PICAXE DATALOGGER
11) Using the SEN008 Humidity Sensor ( Honeywell HIH4000-001) .
There are various humidity sensors on the market, but the
recommended device for use with the PICAXE datalogger is
the Honeywell HIH4000-001. This sensor is a direct humidity
to voltage device (with linear output), and it even has three
pins which can plug straight into the datalogger terminal
block connector CT4 (input1).
As with all humidity sensors, take care not to physically touch
the sensing area of the device, as moisture/oils from the hand
could damage the sensitive sensor element. When inserted
into CT4 the small silver sensing area should be facing up.
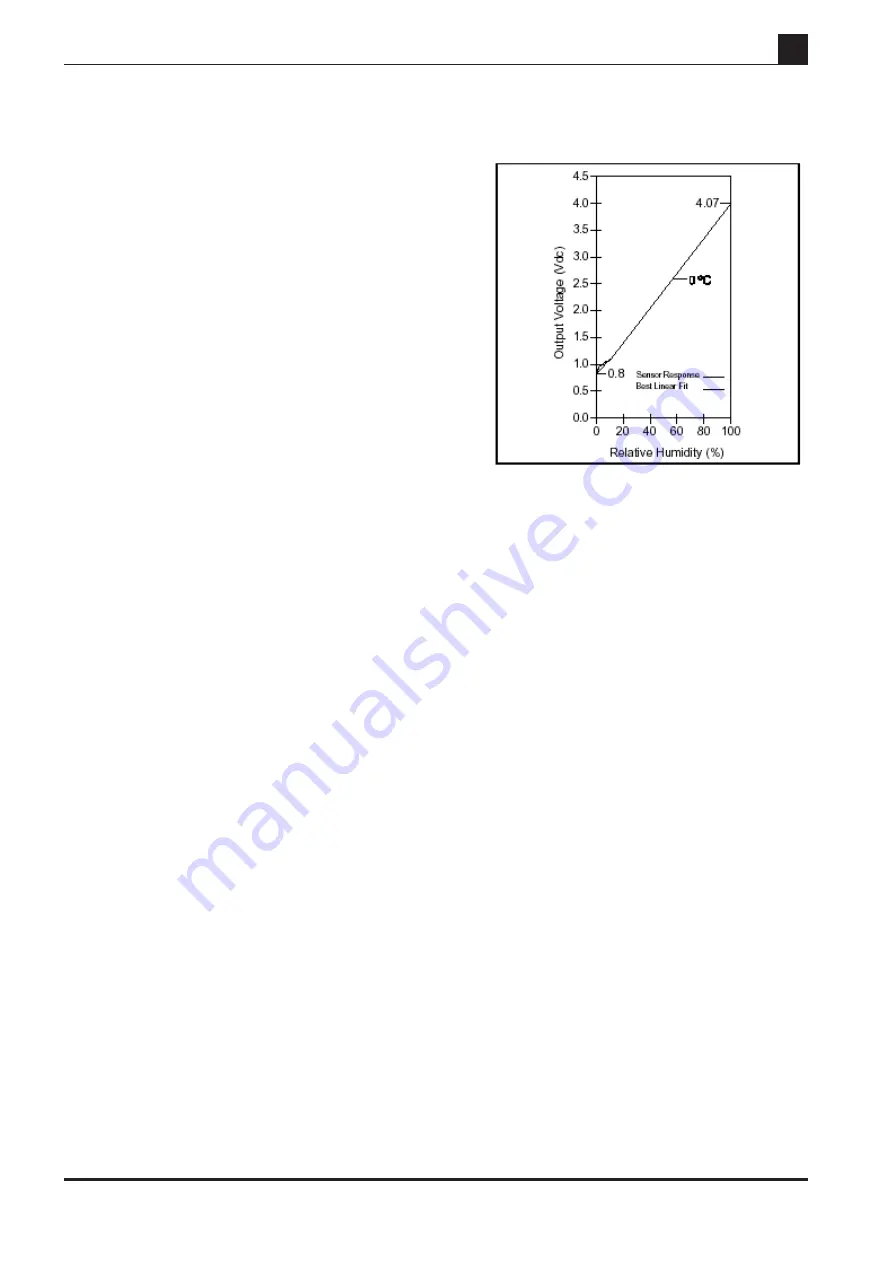
A sample graph of the response of the humidity sensor is
shown in the figure. When used with the PICAXE, the voltage
output of the sensor is measured by the internal analogue-to-
digital converter and stored in a variable (e.g. b1) as a number
between 0 and 255. Each ADC step is 5V/256 = 0.0195V
(assuming use of a regulated 5V supply).
The manufacturers calibration graph shows an offset of approximately 0.8V, which
equate to a ADC value of 41 (0.8 / 0.0195). The RH slope is set at about 0.0306V
per %RH, or 1.57 ADC step per %RH
Therefore the actual RH% can be calculated by the following calculation.
RH = adc value – offset / (slope of graph)
RH = adc value – 41 / (1.57)
However as PICAXE cannot handle fractions, divide by 1.57 is actually calculated as
a mathematical equivalent - multiply by 100 then divide by 157.
RH = adc value – 41 * 100 / 157
Checking these test values against a calibrated test probe using the test program
shown below showed the resulting PICAXE system to be very accurate. However you
may need to ’tweak’ the offset and slope figures depending on sensor calibration,
power supply voltage etc.
main:
readadc 1,b1
‘ read humidity value
let b1 = b1 - 41 * 100 / 157
‘ change to %RH
debug b1
‘ display on computer screen
pause 500
‘ wait 0.5 second
goto main
‘ loop
.


