Ameba-D Application Note
Application Note All information provided in this document is subject to legal disclaimers. © REALTEK 2020. All rights reserved.
14
1.3.4.1
J-Link Debug
Follow the steps to debug and trace code of target project with IAR by J-Link:
(1)
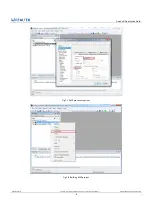
Set the target project as active project and verify the debugger configurations as step (1) and (2).
(2)
Click
Project
>
Download and Debug
or
Project
>
Debug without Downloading
.
Download and Debug: downloads the application and debug the project object file. If necessary, a make will be performed before
download to ensure the project is up to date.
Debug without Downloading: debug the project object file
(3)
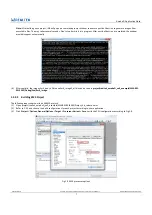
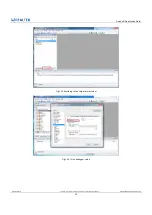
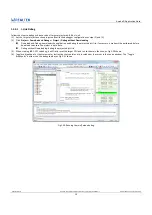
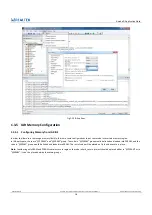
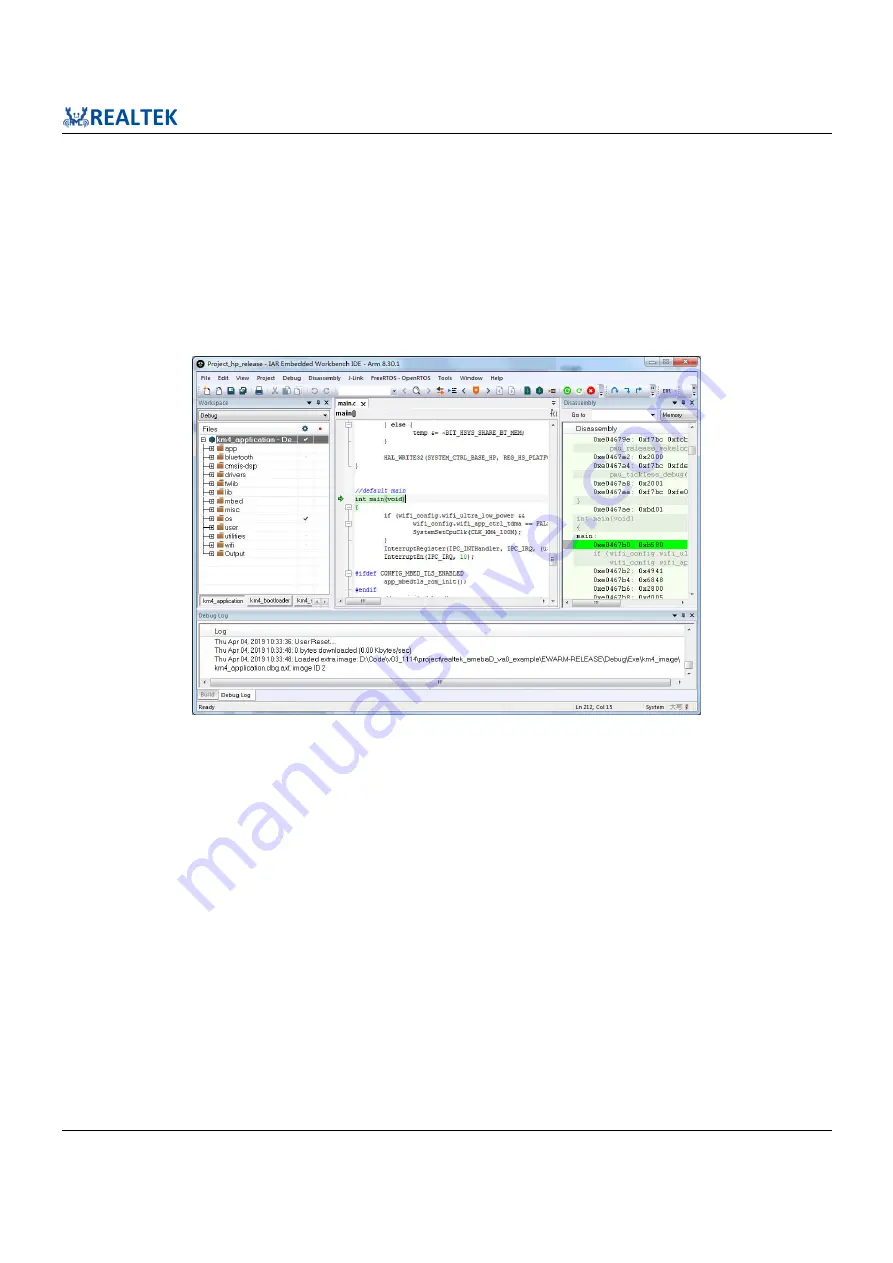
When starting IAR C-SPY to debug, it will firstly reset the target CPU and run to the main function, as Fig 1-20 shows.
(4)
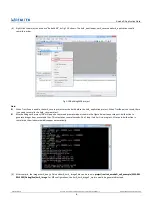
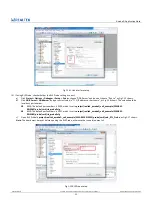
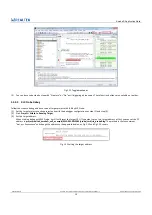
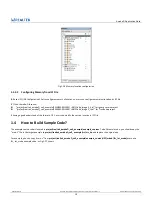
Toggles a breakpoint at the statement or instruction that contains or is located near the cursor in the source window. The “Toggle
Breakpoint” button is on the debug toolbar, as Fig 1-21 shows.
Fig 1-20 Running to main() when debug

