Tiger 320 Series Programming Code Sheet
Draft Copy. Code Version V3.08a
Texmate Inc. Tel. (760) 598 9899 • www.texmate.com
10
2 February, 2005 Prog. Code Sheet V3.08a (NZ101)
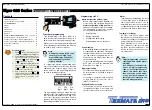
Logirithmic Bargraph Scaling
In all logirithmic scales a reference level is
required that is the level at 0 dB.
For example, in an RF measurement 0 dBm is at
a reference of 1 mW.
The scale is calculated from:
If the meter is scaled so that:
1 mW = 100 counts and 1 W = 100,000 counts
Then the reference for 0 dBm would be set to 100
counts:
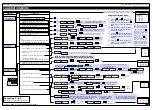
BARGRAPH DISPLAY SETTINGS
0 No Function
1 Disable
Overrange
Flashing
2 Set
up
Colors
3 Set up Bar Scaling
BARGRAPH DISPLAY FORMAT
BARGRAPH TYPE
0 Linear
1 Via
linearization
Table
1
2 –
3 Log
– 10 Bar/Decade
4 Log
– 20 Bar/Decade
5 Log
– 25 Bar/Decade
6 Log – 33 Bar/Decade
7 Log – 50 Bar/Decade
CODE 10 – BARGRAPH SETUP
0 Setpoints on Bar
1 Peak, Valley on Bar
2 -
3 -
4 Min/Max with setpoints (low end of bar =
VALLEY, high end of bar = PEAK)
5 -
6 -
7 Bar Only (no setpoints on the bar)
Code 10 is only available with
bargraph versions of the meter
Note:
Data source for the bargraph is set
up in Code 1 [X51].
CODE 10
P
P
P
P
P
P
P
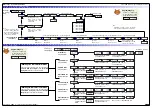
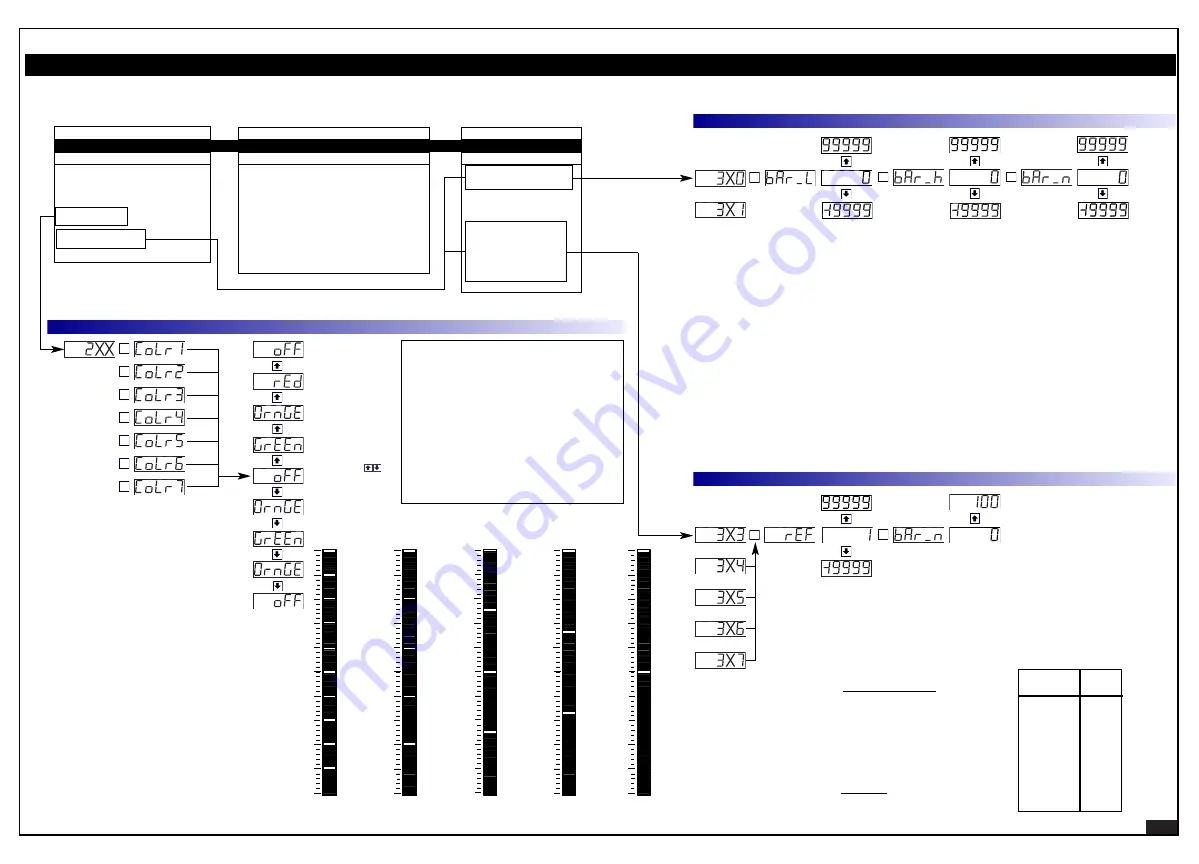
The bargraph colors are not applied to specific setpoints.They
are applied to whichever setpoint is configured at the lowest
setting and then to each next highest setpoint in turn.
If all six setpoints are used the colors are set as follows:
Color 1
Color BELOW lowest setpoint
This is the bargraph color before it reaches
a setpoint.
Color 2
Color ABOVE lowest setpoint
Color 3
Color ABOVE next highest setpoint
Color 4
Color ABOVE next highest setpoint
Color 5
Color ABOVE next highest setpoint
Color 6
Color ABOVE next highest setpoint
Color 7
Color ABOVE highest setpoint
Set Up Bargraph Colors
P
Set Up Scaling for Linear Bargraph
OR
P
P
Bar Low
Bar High
Bar Nominal
P
Set Up Scaling for Logirithmic Bargraph
OR
P
Reference
Bar Nominal
OR
OR
OR
FIRST DIGIT
SECOND DIGIT
THIRD DIGIT
Pressing the
buttons at the same
time returns to [oFF]
Bar Nominal
Bar Nominal sets the point on the bargraph at which the bar
begins to light up. This can be any position between and includ-
ing the bar low and bar high settings.
If bar nominal is set to the
bar low
setting, the bargraph
behaves like a typical bargraph making the segments light up
from the
bottom
of the bar and grow towards the top.
If bar nominal is set to the
bar high
setting, this makes all seg-
ments from the displayed signal to the
top
of the bar light up.
As the signal increases, the number of lit segments between
the signal and the bar high setting becomes steadily less.When
the signal reaches the bar high setting no segments are lit.
Setting bar nominal to the midpoint between bar low and bar
high makes the bargraph behave like a typical center zero bar-
graph. This means the bargraph lights up at the center of the
bar and moves either up or down the bar depending on the dis-
played signal.
An added feature of this bargraph is that it can also be non-
symetrical. This means that the bar nominal setting does not
need to be set at the mid-point between bar low and bar high.
For example, if the bargraph is configured to display –200 to
800 °C, bar low is set to –200 counts and bar high is set to 800
counts. Bar nominal is set to 0 counts. If a signal of –50 °C is
applied, the bar lights from 0 down to –50. If a signal of 600 °C
is applied, the bar lights from 0 up to 600.
For example, if the meter's full scale range is 20,000 counts, the
midpoint is 10,000 counts. If a signal of 10,000 counts is
applied, only one segment at the 10,000 count mark lights up.
If a signal of 17,000 counts is applied, the segments between
the center segment (10,000 counts) and the 17,000 count mark
light up.
If a signal of 5000 counts is applied, the segments between
the center segment (10,000 counts) and the 5000 count
mark light up.
10 log
10
(input)
100
= 0 dBm
Decade
(Counts)
–20
–10
0
10
20
30
40
1
10
100
1000
10,000
100,000
1,000,000
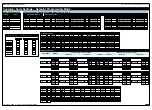
Now every 10 dBm represents a decade, the bargraph
can be scaled to a different amount of bars per decade
(as set in the 3rd digit).
See Example of Bars per Decade diagram opposite.
dBm
Reference
. This is the number of counts dis-
played for a 0 dB reference.
Bar Nominal
. See Bar Nominal description
above.
100 dBm
80 dBm
60 dBm
40 dBm
20 dBm
0 dBm
10 Bars/Decade
90 dBm
70 dBm
50 dBm
30 dBm
10 dBm
40 dBm
20 dBm
0 dBm
20 Bars/Decade
50 dBm
30 dBm
10 dBm
40 dBm
0 dBm
25 Bars/Decade
30 dBm
20 dBm
10 dBm
0 dBm
33 Bars/Decade
30 dBm
20 dBm
10 dBm
0 dBm
50 Bars/Decade
20 dBm
10 dBm
100
1000
10,000
100,000
1,000,000
100
1000
10,000
100,000
1,000,000
100
1000
10,000
100,000
1,000,000
100
1000
10,000
100,000
100
1000
10,000
Example of Bars per Decade
10 log
10
counts (input)
reference

