98
Chapter 12. Tracepoints
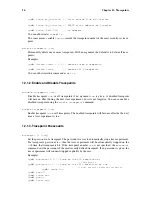
tfind start
Find the first snapshot in the buffer. This is a synonym for
tfind 0
(since 0 is the number of the
first snapshot).
tfind none
Stop debugging trace snapshots, resume
live
debugging.
tfind end
Same as
tfind none
.
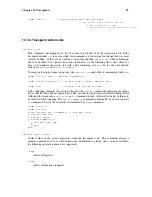
tfind
No argument means find the next trace snapshot.
tfind -
Find the previous trace snapshot before the current one. This permits retracing earlier steps.
tfind tracepoint
num
Find the next snapshot associated with tracepoint
num
. Search proceeds forward from the last
examined trace snapshot. If no argument
num
is given, it means find the next snapshot collected
for the same tracepoint as the current snapshot.
tfind pc
addr
Find the next snapshot associated with the value
addr
of the program counter. Search proceeds
forward from the last examined trace snapshot. If no argument
addr
is given, it means find the
next snapshot with the same value of PC as the current snapshot.
tfind outside
addr1
,
addr2
Find the next snapshot whose PC is outside the given range of addresses.
tfind range
addr1
,
addr2
Find the next snapshot whose PC is between
addr1
and
addr2
.
tfind line [
file
:]
n
Find the next snapshot associated with the source line
n
. If the optional argument
file
is given,
refer to line
n
in that source file. Search proceeds forward from the last examined trace snapshot.
If no argument
n
is given, it means find the next line other than the one currently being examined;
thus saying
tfind line
repeatedly can appear to have the same effect as stepping from line to
line in a
live
debugging session.
The default arguments for the
tfind
commands are specifically designed to make it easy to scan
through the trace buffer. For instance,
tfind
with no argument selects the next trace snapshot, and
tfind -
with no argument selects the previous trace snapshot. So, by giving one
tfind
command,
and then simply hitting [RET] repeatedly you can examine all the trace snapshots in order. Or, by
saying
tfind -
and then hitting [RET] repeatedly you can examine the snapshots in reverse order.
The
tfind line
command with no argument selects the snapshot for the next source line executed.
The
tfind pc
command with no argument selects the next snapshot with the same program counter
(PC) as the current frame. The
tfind tracepoint
command with no argument selects the next trace
snapshot collected by the same tracepoint as the current one.
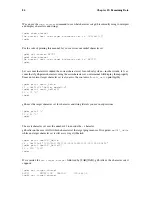
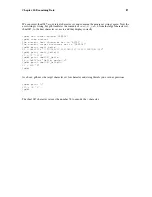
In addition to letting you scan through the trace buffer manually, these commands make it easy to
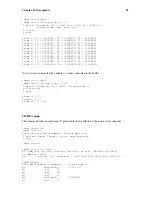
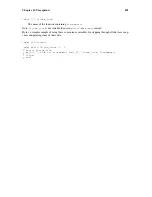
construct gdb scripts that scan through the trace buffer and print out whatever collected data you are
interested in. Thus, if we want to examine the PC, FP, and SP registers from each trace frame in the
buffer, we can say this:
Summary of Contents for ENTERPRISE LINUX 3 - SECURITY GUIDE
Page 1: ...Red Hat Enterprise Linux 3 Debugging with gdb ...
Page 12: ...2 Chapter 1 Debugging with gdb ...
Page 28: ...18 Chapter 4 Getting In and Out of gdb ...
Page 34: ...24 Chapter 5 gdb Commands ...
Page 44: ...34 Chapter 6 Running Programs Under gdb ...
Page 68: ...58 Chapter 8 Examining the Stack ...
Page 98: ...88 Chapter 10 Examining Data ...
Page 112: ...102 Chapter 12 Tracepoints ...
Page 118: ...108 Chapter 13 Debugging Programs That Use Overlays ...
Page 138: ...128 Chapter 14 Using gdb with Different Languages ...
Page 144: ...134 Chapter 15 Examining the Symbol Table ...
Page 170: ...160 Chapter 19 Debugging remote programs ...
Page 198: ...188 Chapter 21 Controlling gdb ...
Page 204: ...194 Chapter 22 Canned Sequences of Commands ...
Page 206: ...196 Chapter 23 Command Interpreters ...
Page 216: ...206 Chapter 25 Using gdb under gnu Emacs ...
Page 296: ...286 Chapter 27 gdb Annotations ...
Page 300: ...290 Chapter 28 Reporting Bugs in gdb ...
Page 322: ...312 Chapter 30 Using History Interactively ...
Page 362: ...352 Appendix D gdb Remote Serial Protocol ...
Page 380: ...370 Appendix F GNU GENERAL PUBLIC LICENSE ...
Page 386: ...376 Appendix G GNU Free Documentation License ...
Page 410: ......


