8
Chapter 3. A Sample gdb Session
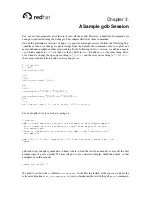
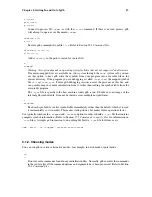
(gdb)
break m4_changequote
Breakpoint 1 at 0x62f4: file builtin.c, line 879.
Using the
run
command, we start
m4
running under gdb control; as long as control does not reach the
m4_changequote
subroutine, the program runs as usual:
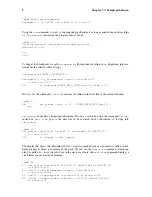
(gdb)
run
Starting program: /work/Editorial/gdb/gnu/m4/m4
define(foo,0000)
foo
0000
To trigger the breakpoint, we call
changequote
. gdb suspends execution of
m4
, displaying informa-
tion about the context where it stops.
changequote(
QUOTE
,
UNQUOTE
)
Breakpoint 1, m4_changequote (argc=3, argv=0x33c70)
at builtin.c:879
879
if (bad_argc(TOKEN_DATA_TEXT(argv[0]),argc,1,3))
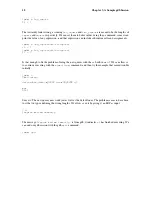
Now we use the command
n
(
next
) to advance execution to the next line of the current function.
(gdb)
n
882
set_quotes((argc
= 2) ? TOKEN_DATA_TEXT(argv[1])\
: nil,
set_quotes
looks like a promising subroutine. We can go into it by using the command
s
(
step
)
instead of
next
.
step
goes to the next line to be executed in
any
subroutine, so it steps into
set_quotes
.
(gdb)
s
set_quotes (lq=0x34c78 "
QUOTE
", rq=0x34c88 "
UNQUOTE
")
at input.c:530
530
if (lquote != def_lquote)
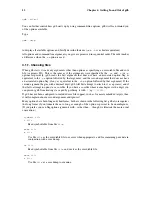
The display that shows the subroutine where
m4
is now suspended (and its arguments) is called a stack
frame display. It shows a summary of the stack. We can use the
backtrace
command (which can
also be spelled
bt
), to see where we are in the stack as a whole: the
backtrace
command displays a
stack frame for each active subroutine.
(gdb)
bt
#0
set_quotes (lq=0x34c78 "
QUOTE
", rq=0x34c88 "
UNQUOTE
")
at input.c:530
#1
0x6344 in m4_changequote (argc=3, argv=0x33c70)
at builtin.c:882
#2
0x8174 in expand_macro (sym=0x33320) at macro.c:242
#3
0x7a88 in expand_token (obs=0x0, t=209696, td=0xf7fffa30)
at macro.c:71
Summary of Contents for ENTERPRISE LINUX 3 - SECURITY GUIDE
Page 1: ...Red Hat Enterprise Linux 3 Debugging with gdb ...
Page 12: ...2 Chapter 1 Debugging with gdb ...
Page 28: ...18 Chapter 4 Getting In and Out of gdb ...
Page 34: ...24 Chapter 5 gdb Commands ...
Page 44: ...34 Chapter 6 Running Programs Under gdb ...
Page 68: ...58 Chapter 8 Examining the Stack ...
Page 98: ...88 Chapter 10 Examining Data ...
Page 112: ...102 Chapter 12 Tracepoints ...
Page 118: ...108 Chapter 13 Debugging Programs That Use Overlays ...
Page 138: ...128 Chapter 14 Using gdb with Different Languages ...
Page 144: ...134 Chapter 15 Examining the Symbol Table ...
Page 170: ...160 Chapter 19 Debugging remote programs ...
Page 198: ...188 Chapter 21 Controlling gdb ...
Page 204: ...194 Chapter 22 Canned Sequences of Commands ...
Page 206: ...196 Chapter 23 Command Interpreters ...
Page 216: ...206 Chapter 25 Using gdb under gnu Emacs ...
Page 296: ...286 Chapter 27 gdb Annotations ...
Page 300: ...290 Chapter 28 Reporting Bugs in gdb ...
Page 322: ...312 Chapter 30 Using History Interactively ...
Page 362: ...352 Appendix D gdb Remote Serial Protocol ...
Page 380: ...370 Appendix F GNU GENERAL PUBLIC LICENSE ...
Page 386: ...376 Appendix G GNU Free Documentation License ...
Page 410: ......


