5.
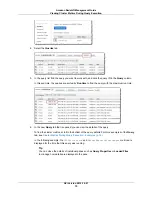
In the load list find the load operation you want to work with, and click the load ID in the Load column.
6.
In the new Query tab that is opened you can view the details of the load operation.
At this point, you can work with the Query tab as shown in
Viewing Cluster Metrics During Query
Execution (p. 74)
.You can review the details of the query and see the values of cluster metrics during
the load operation.
Creating an Alarm
Alarms you create in the Amazon Redshift console are Amazon CloudWatch alarms. They are useful
because they help you make proactive decisions about your cluster and its databases. You can set one
or more alarms on any of the metrics listed in
Amazon Redshift CloudWatch Metrics (p. 68)
. For example,
setting an alarm for high
CPUUtilization
on a cluster node will help indicate when the node is
over-utilized. Likewise, setting an alarm for low
CPUUtilization
on a cluster node, will help indicate
when the node is underutilized.
This section explains how to create an alarm using the Amazon Redshift console. You can create an
alarm using the Amazon CloudWatch console or any other way you typically work with metrics such as
with the Amazon CloudWatch Command Line Interface (CLI) or one of the Amazon Software Development
Kits (SDKs). To delete an alarm, you must use the Amazon CloudWatch console.
To create an alarm on a cluster metric in the Amazon Redshift console
1.
Sign into the AWS Management Console and open the Amazon Redshift console at
https://console.aws.amazon.com/redshift
.
2.
In the left navigation, click Clusters.
3.
In the cluster list, select the cluster for which you want to view cluster performance during query
execution.
4.
Select the Alarms tab.
API Version 2012-12-01
78
Amazon Redshift Management Guide
Creating an Alarm


