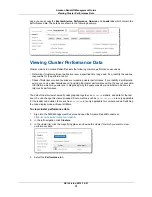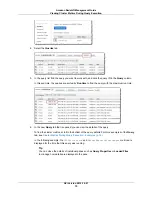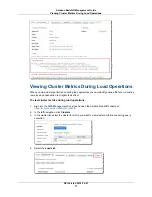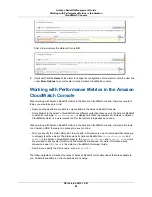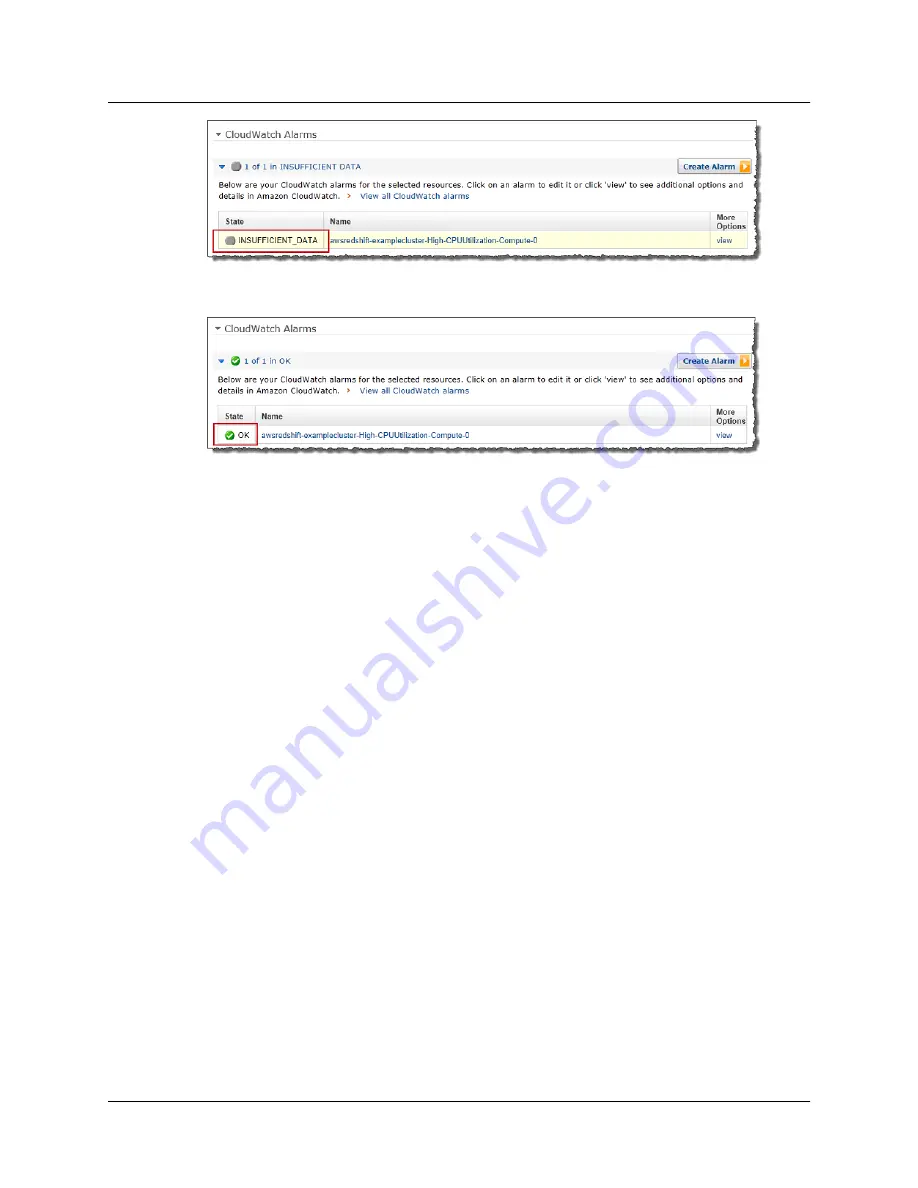
After a few moments the state will turn to OK.
8.
(Optional) Click the Name of the alarm to change the configuration of the alarm or click the view link
under More Options to go to this alarm in the Amazon CloudWatch console.
Working with Performance Metrics in the Amazon
CloudWatch Console
When working with Amazon Redshift metrics in the Amazon CloudWatch console, there are couple of
things you should keep in mind:
• Query and load performance data is only available in the Amazon Redshift console.
• Some Metrics in the Amazon CloudWatch have different units than those used in the Amazon Redshift
console. For example,
WriteThroughput
, is displayed in GB/s (as compared to Bytes/s in Amazon
CloudWatch) which is a more relevant unit for the typical storage space of a node.
When working with Amazon Redshift metrics in the Amazon CloudWatch console, command line tools,
or an Amazon SDK, there are two concepts to keep in mind.
• First, you specify the metric dimension to work with. A dimension is a name-value pair that helps you
to uniquely identify a metric. The dimensions for Amazon Redshift are
ClusterIdentifier
and
NodeID
. In the Amazon CloudWatch console, the
Redshift Cluster
and
Redshift Node
views
are provided to easily select cluster and node-specific dimensions. For more information about
dimensions, see
Dimensions
in the Amazon CloudWatch Developer Guide.
• Second, you specify the metric name, such as
ReadIOPS
.
The following table summarizes the types of Amazon Redshift metric dimensions that are available to
you. All data is available in 1-minute periods at no charge.
API Version 2012-12-01
80
Amazon Redshift Management Guide
Working with Performance Metrics in the Amazon
CloudWatch Console

