Section 8. Processing and Program Control Examples
8-27
19:
P
End Table 1
*
A
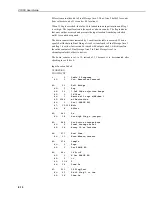
Mode 10 Memory Allocation
01:
1030
Input Locations
02:
260
Intermediate Locations
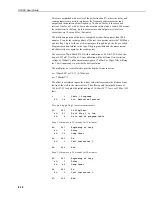
Example with Bin Averaging
The CR10X was used to generate data simulating wave data from an ocean buoy
with four superimposed sine wave signals, 0.1, 0.125, 0.14, and 0.2Hz. The 2048
generated samples simulate a sampling rate of 0.5Hz or a 2.0 second scan rate.
Figure 8-5 shows a plot of part of the simulated signal. An FFT with 8-bin averag-
ing was performed on the data. A multiplier of 0.1 was used to keep the FFT
results smaller than the +6999 upper limit of low resolution Final Storage data.
The results of the FFT are shown in Table 8-8 and illustrated in Figure 8-6.
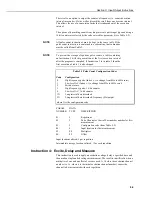
In the example program, a multiplier of 0.1 is used in the FFT instruction. By
reducing the FFT results by a factor of 10, the low resolution output format can be
used, thus maximising the Final Storage capacity. A low resolution data point
requires two bytes of Final Storage memory, while a high resolution data point
requires four bytes. When memory is a limiting factor, the data should be scaled
to be less than 6999, so the low resolution format can be used.
TIME IN SECONDS
WAVE HEIGHT
FREQ/AMPL .1/11, .125/9, .14/6, .2/4
0
6
12
18
24
30
36
42
48
54
60
66
72
78
84
90
96 102 108 114
30
20
10
0
-10
-20
-30
IN FEET
Figure 8-5 Simulated Ocean Buoy Wave Data


