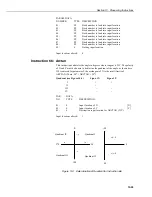
CR10X Reference Manual
11-2
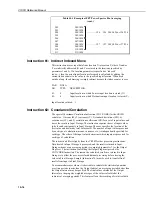
PARAM.
DATA
NUMBER TYPE
DESCRIPTION
01:
2
Repetitions
02:
4
Samples per sub-interval (number of scans)
03:
2
Sensor/Output (two digits):
AB
A Sensor type:
0 = Speed and Direction
1 = East and North
B Output option:
0
S,
Θ
Θ
Θ
Θ
1,
σσσσ
(
Θ
Θ
Θ
Θ
1)
1
S,
Θ
Θ
Θ
Θ
1
2
S, U,
Θ
Θ
Θ
Θ
u,
σσσσ
(
Θ
Θ
Θ
Θ
u)
04:
4
First wind speed input location no. (East wind speed)
05:
4
First wind direction input location no. (North wind speed)
Outputs Generated: 2-4 (depending on output option) per repetition
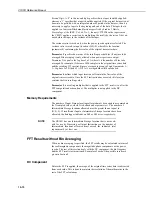
A sub-interval is specified as a number of scans. The number of scans for a sub-
interval is given by:
Desired sub-interval (secs) / scan rate (secs)
In an example where the scan rate is 1 second and the Output Flag is set every 60
minutes, the standard deviation is calculated from all 3600 scans when the sub-
interval is 0. With a sub-interval of 900 scans (15 minutes) the standard deviation
is the average of the four sub-interval standard deviations. The last sub-interval is
weighted if it does not contain the specified number of scans.
There are three output options, which specify the values calculated.
Option 0:
Mean horizontal wind speed,
S
.
Unit vector mean wind direction,
Θ
Θ
Θ
Θ
1
.
Standard deviation of wind direction,
σσσσ
(
Θ
Θ
Θ
Θ
1)
.
Standard deviation is calculated using the Yamartino algorithm. This option
complies with EPA guidelines for use with straight-line Gaussian dispersion
models to model plume transport.
Option 1:
Mean horizontal wind speed,
S.
Unit vector mean wind direction,
Θ
Θ
Θ
Θ
1
.
Option 2:
Mean horizontal wind speed,
S
.
Resultant mean wind speed,
U
.
Resultant mean wind direction,
Θ
Θ
Θ
Θ
u
.
Standard deviation of wind direction,
σσσσ
(
Θ
Θ
Θ
Θ
u)
.
This standard deviation is calculated using Campbell Scientific’s wind-
speed-weighted algorithm.

