Section 10. Processing Instructions
10-17
over longer time periods by removing the effect of longer period frequencies in the
input signals; i.e. it provides a high pass filter. For example, assume the variance of
an input is desired. It is determined that the averaging period should not exceed 5
minutes due to variation in the mean over longer time intervals. One approach is to
calculate and record the variance every 5 minutes. By specifying the subinterval
averaging period as 5 minutes and the Output Interval as 1 hour, however, the
average of the 5-minute variances are recorded every hour. The averaging period is
entered as the number of input samples in parameter 7 of the COV/CORR
Instruction. The number of samples for a given period is given by:
Number of Samples =
Averaging period in seconds
Table execution interval in seconds
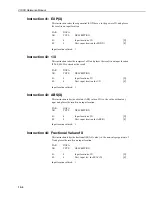
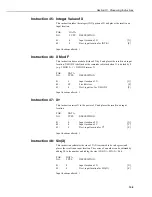
PARAM.DATA
NUMBER
TYPE
DESCRIPTION
01:
2
Number of input values located sequentially in
input memory
02:
2
Number of means desired
03:
2
Number of variances desired
04:
2
Number of standard deviations desired
05:
2
Number of covariances desired
06:
2
Number of correlations desired
07:
FP
Number of input samples in averaging period
08:
4
Input storage location of first value in sequential
input string
09:
4
First Input Storage location to store string of final
results
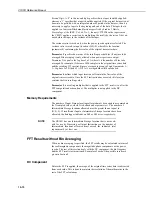
Table 10-2 shows the maximum number of outputs which can be generated and
the output order for K input values located sequentially in Input Storage. The
output order shown in Table 10-2 flows from left to right and top to bottom.
If the specified number of samples in the averaging period (Parameter 7) exceeds
the actual number of samples occurring in the Output Interval, the Output Interval
becomes the averaging period.
Maximum Number of Possible Outputs
No limitation exists on the number of inputs that can be processed by the
COV/CORR Instruction, but the processing time and Intermediate Storage
requirements increase rapidly. The instruction requires that the input values reside
sequentially in Input Storage. Since the number of outputs is specified for each
type of statistical calculation, the instruction starts with the first value, working
sequentially through the input values. For this reason, the order of the input values
determines which values are processed.
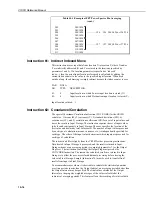
Table 10-2 shows the maximum number of outputs which can be generated and
the output order for K input values located sequentially in Input Storage. The
output order shown in Table 10-2, below, flows from left to right and top to
bottom.


