CHAPTER 13 S1C88 FAMILY DEBUGGER
100
EPSON
S5U1C88000C MANUAL II
WORKBENCH/DEV TOOLS/OLD ASSEMBLER
13.4.8 [Trace] Window
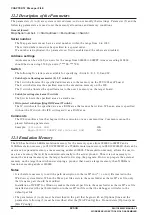
After the trace function is turned on by the md command, the debugger samples trace information while
the target program is running. The trace data buffer has a capacity for 8192 instructions (overwritten from
the beginning if the capacity is exceeded), and its data can be displayed in the [Trace] window.
The following lists the trace contents:
• Instruction number
• Fetched code and disassembled contents
• Register and condition flag contents
• Memory access status (R/W, address, data)
This window also displays the trace data search results by the ts command.
∗
Updating of display
The contents of the [Trace] window are cleared when the target program is executed. After the
execution has finished, the [Trace] window displays the contents of the trace buffer.
13.4.9 [Coverage] Window
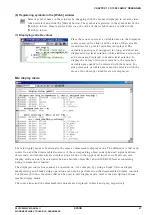
This window shows the coverage information
(executed address information) acquired by the ICE.
The displayed contents indicate the memory map in
16 bytes per line. The value at the beginning of each
line is a physical address (hexadecimal value).
Asterisks (
∗
) in the line indicate the executed ad-
dresses within a 16-byte area beginning with the
displayed address. The Count values are number of
executed addresses in the line.
The [Coverage] window does not update its displayed contents automatically even if a program execu-
tion is suspended. To update the display, select [Coverage] from the [Coverage] menu or execute the cv
command. To clear the coverage information acquired in the ICE and display contents in the [Coverage]
window, select [Coverage Clear] from the [Coverage] menu.

