CHAPTER 13 S1C88 FAMILY DEBUGGER
116
EPSON
S5U1C88000C MANUAL II
WORKBENCH/DEV TOOLS/OLD ASSEMBLER
13.8.4 Executing Program
The debugger can execute the target program successively or execute instructions one step at a time
(single-stepping).
Successive execution
(1) Types of successive execution
There are three types of successive execution available:
• Successive execution from the current PC
• Successive execution from the current PC to the cursor position in the [Source] window
• Successive execution after resetting the CPU
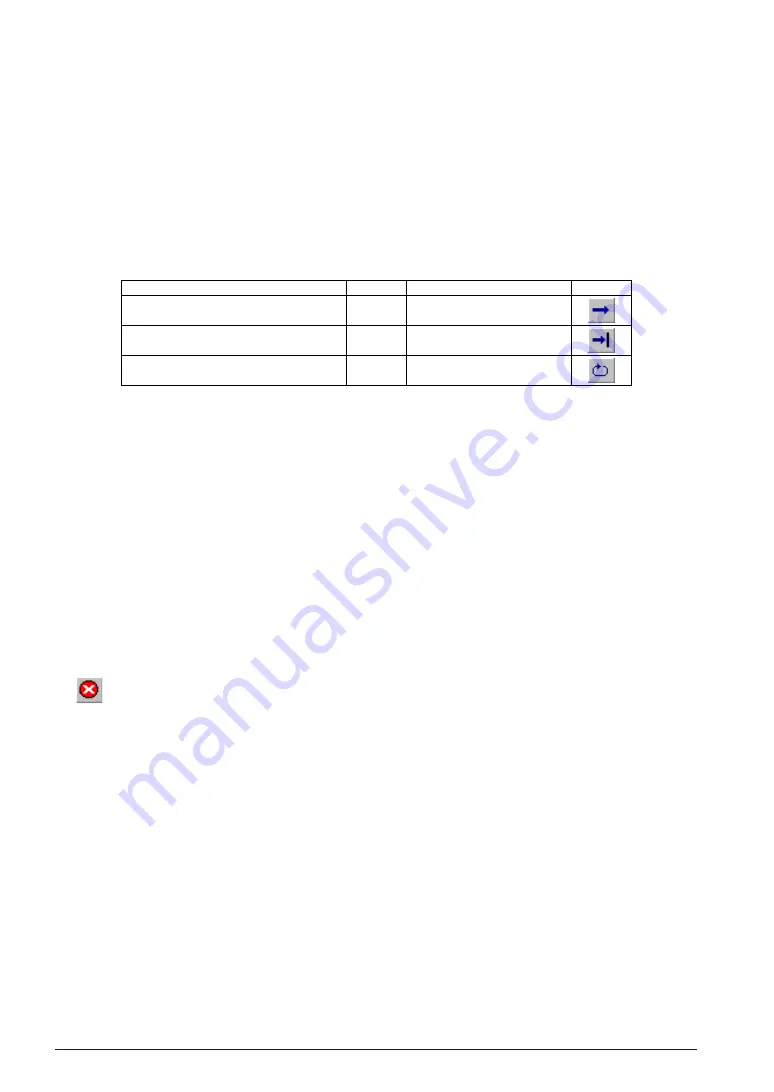
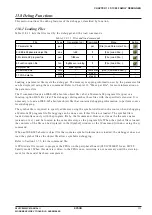
Table 13.8.4.1 Commands/menu items/tool bar buttons for successive execution
Function
Successive execution from current PC
Successive execution from current PC
to cursor position
Successive execution after resetting CPU
Command
g
–
gr
Button
Menu
[Run | Go]
[Run | Go to Cursor]
[Run | Go after Reset]
(2) Stopping successive execution
Temporary break addresses can be specified in the [Source] window.
If the cursor is placed on an address line in the [Source] window and the [Go to Cursor] button clicked, the
program starts executing from the current PC address and breaks immediately before executing the
instruction at the address the cursor is placed.
Note that when displaying C source in source display mode, the cursor must be located at one of the
source lines expanded into effective source code. If the cursor is located at any source line, such as a
comment line or declaration statement that is not compiled into object code, the program is not executed,
even if you click the [Go to Cursor] button. (Refer to the description of the PC break function.)
Except being stopped by this temporary break, the program continues execution until it is stopped by one
of the following causes:
• Break conditions set by a break set up command are met.
• A break signal is input to the ICE BRKIN pin.
• The [Key Break] button is clicked, the [Run | Stop] menu command is selected or the [Esc] key is
pressed.
• A program execution error is detected.
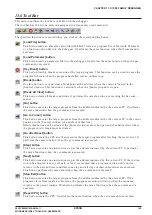
[Key Break] button
∗
When the program does not stop, use this button to forcibly stop it.
Note: If program execution is halted in C source display mode, the debugger displays the source for an
object that includes the halted address. However, if no sources exist at the halted address, a
[Source Files] dialog box is displayed, prompting for selection of a source file.
(3) Display during successive executions
The display is updated as below due to a successive execution.
When program execution is halted, the [Command] window displays the number of executed cycles
and execution time.
Example:
>g
BUS CYCLE : 428649
... Number of bus cycles
Mode L : 001min 002s 543ms 468us
... Execution time (1 µs units by default)
The [Source], [Register] and [Dump] windows do not change their display contents while the program
is executing and updates after the program execution is halted. If the [Register] window is closed, its
contents are displayed in the [Command] window. The [Trace] window clears its display contents
when the program execution is started and re-displays the latest trace data after the program execu-
tion is halted. The [Watch] window is updated after the program execution is halted by default. It can
be changed so that the window is updated in specified cycles using the dialog that appears by using
the [Run | Setting...] menu command.
The [Symbol ] and [Coverage] windows do not change their display contents due to successive
executions.


