Source Viewer
QT
RACE
-
U
SER
M
ANUAL
© 2018 PDQLogic Ltd.
QTrace User Manual Rev 1.01
Page 14
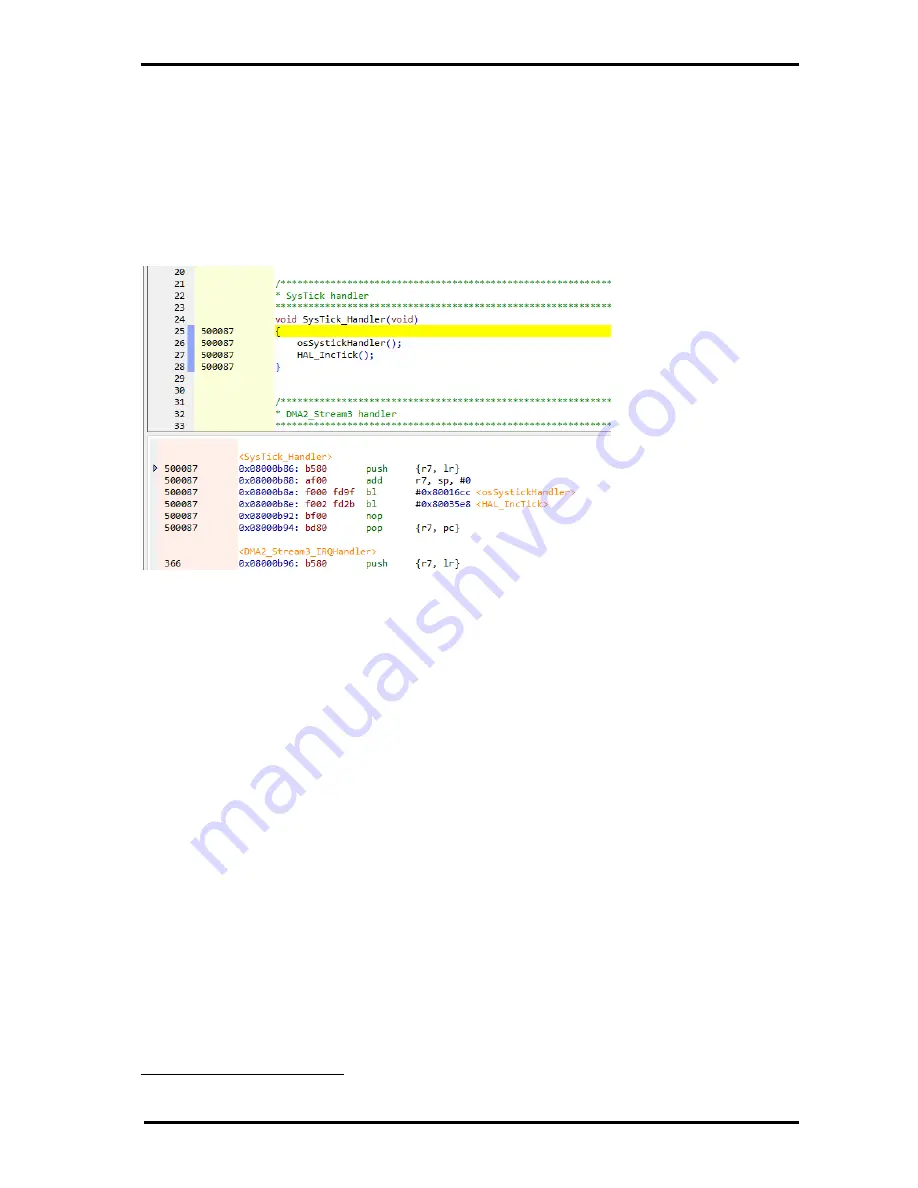
One of the most useful features in the source file view is the yellow vertical margin in the left hand side
of the view which displays execution counts for each source line. This is referred to as code coverage.
3.2.1
Code coverage
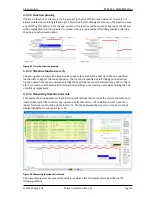
A purple block to the right of the source file line number indicates that there are underlying processor
instructions i.e. it is not just a comment or white space. To the right of each purple ‘code block’ is a
count of how many times the source line has been executed. If there is no count displayed i.e. it is blank,
then the line has not yet been executed. A similar view is shown in the disassembly window in its pink
coloured margin.
Figure 7 Code coverage in source and disassembly views
Trace data is constantly being decoded as the target program is running and as long as there is no trace
buffer overflow
4
then the number of times that each CPU instruction has been executed will be
recorded. These instructions are cross referenced to C/C++ source lines and are displayed as execution
counts in the in the yellow source view margin next to the source line. The CPU instruction execution
counts are displayed in the pink margin of the disassembly window.
Note that recording execution counts for each instruction is not the same as recording every single
instruction that has been executed since reset to allow an entire execution timeline to be reconstructed.
There is, however, a similar feature in the QTrace Analyser which is limited to 8 million consecutive
instructions, see Trace Capture in section 4.
Having an indication of whether a source line has been executed, and how many times, is very powerful.
This feature is similar to having a breakpoint on every source code line but without actually affecting
processor execution. Although variables and register values can’t be inspected, knowing where the
processor has been and how many times is a ‘smoking gun’ for debugging tricky problems. This is
something that break-and-step debugging only gives when a breakpoint is hit and will be missed if a
break point was not in place when code of interest was executed.
This feature is much more effective and timesaving than sprinkling code with printf debug statements to
know if a particular line was executed. Adding debug code will alter execution timing and may
compound an issue being investigated.
4
Overflow shouldn’t happen with a suitable PC specification (see Section 10)


