Trace Configuration
QT
RACE
-
U
SER
M
ANUAL
© 2018 PDQLogic Ltd.
QTrace User Manual Rev 1.01
Page 40
6.1.13
Trace configuration source
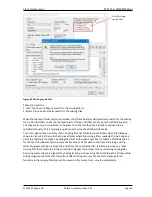
The target trace registers can be configured by the target firmware or via a debugger script.
When trace is configured via firmware, there will be a delay between the trace stream starting and the
QTrace Analyser synchronising to it. Any instructions between these two points will be lost.
Using a debugger script is the preferred way to configure trace as it allows all instructions executed
after reset to be traced and does not require changes to the application source. When configuration via
a debug script is selected, the initialisation RAM Area and Debugger Script text boxes are enabled.
6.1.14
Initialisation RAM area
This specifies the base address of the RAM which will be used by the debugger script during trace
configuration. In most Cortex-M processor implementations this is 0x20000000.
6.1.15
Debugger script
This is the path of the script file that will be used to configure the target trace interface prior to running
the application. The script is run by the debugger after it has re-programmed the target FLASH but
before it runs the application. The script will configure the appropriate GPIO pins for trace operation
and will then configure the ETM trace registers which are common to all Cortex-M processor
implementations. The script will then run a dummy program in RAM for several 100ms to give the
QTrace Analyser time to detect, and synchronise with, the trace data stream.
A number of debugger scripts are supplied with the QTrace Analyser which support most common IDEs.
See Table 1 on page 6 for further details.
Note:
When using a debugger script, it is important that the firmware does not write to any of the trace pin
GPIO configuration registers or to the trace hardware registers as this will likely cause tracing to fail.
6.1.16
Trace port voltage
The QTrace probe supports two nominal voltage ranges, 1.8V and 3.3V. Refer to Table 2 on page 7 for
minimum and maximum voltage levels.
6.2
Finalising trace configuration
Pressing OK in the trace configuration dialog will initiate a field validation. If one or more fields are not
entered, or have invalid values, then this will be highlighted. Once the fields have been validated,
QTrace Analyser will proceed to create a configuration file.
It is likely that one or more paths that have been parsed from the specified ELF file will not exist on the
filing system or will not contain any source files that were used to create the target image. In this case a
dialog will be displayed showing these paths. In most circumstances the paths can safely be ignored and
simply clicking the ‘Close’ button in Figure 46 is all that’s required. If one or more paths should be
retained e.g. currently unavailable network drive then these entries can be checked before clicking
‘Close’.

