Tracing with common IDEs
QT
RACE
-
U
SER
M
ANUAL
© 2018 PDQLogic Ltd.
QTrace User Manual Rev 1.01
Page 61
12.9
VisualGDB
VisualGDB is a low cost plug-in for MS Visual Studio which adds support for building projects using GCC
and debugging via GDB. It also runs with the free Community edition of Visual Studio to form a powerful
low cost embedded development platform.
The plug-in has support for the very low cost ST-Link/V2 JTAG adapter and the Segger J-Link. In both
cases, the adapter needs to be selected from the ‘JTAG/SWD Programmer’ drop-down list which is
accessed via menu option
Project
VisualGDB Project Properties
.
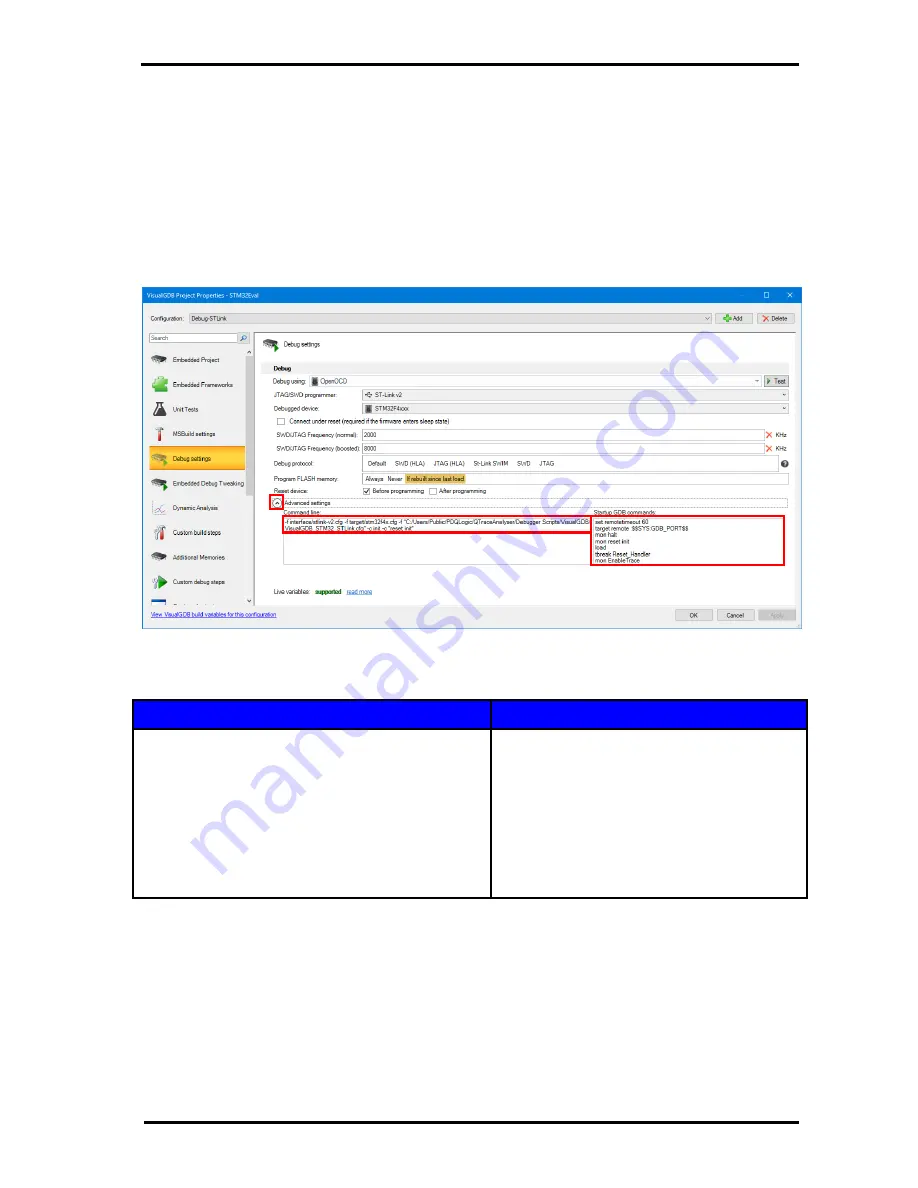
The default settings for the ST-Link need to be modified. Under ‘Advanced Settings’, the ‘Command Line’
and ‘Startup GDB commands’ need to be edited as shown in Figure 67.
Figure 67 VisualGDB ST-Link configuration
For convenience the ‘Advanced Settings’ are reproduced here:
Command line
Startup GDB commands
-f interface/stlink-v2.cfg -f target/stm32f4x.cfg -f
"C:/Users/Public/PDQLogic/QTraceAnalyser/Debugger
Scripts/VisualGDB/VisualGDB_STM32_STLink.cfg" -c
init -c "reset init"
set remotetimeout 60
target remote :$$SYS:GDB_PORT$$
mon halt
mon reset init
load
tbreak Reset_Handler
mon EnableTrace
J-Link
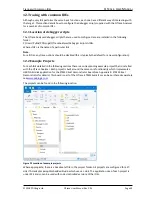
For the J-Link settings, the default VisualGDB settings are suitable as shown in Figure 68.
The contents of the relevant debugger script file e.g.
C:\Users\Public\PDQLogic\QTraceAnalyser\Debugger Scripts\VisualGDB\VisualGDB_STM32_JLink.cfg
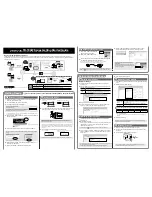
should be pasted into the text box entitled "The following additional GDB commands will be executed
during start-up AFTER selecting a target which is on the "Additional GDB Commands" tab as shown in
Figure 69 below.


