Source Viewer
QT
RACE
-
U
SER
M
ANUAL
© 2018 PDQLogic Ltd.
QTrace User Manual Rev 1.01
Page 16
3.2.2
Code coverage pause and clear
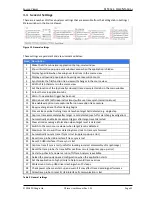
The dynamic code coverage updating can be paused by selecting
View
Pause Code Coverage
. This will
freeze the currently displayed values but the underlying counting will continue. Selecting the menu
option again will resume coverage updating.
The code coverage counts can be cleared by selecting
View
Clear Code Coverage.
3.2.3
Single stepping and execution count latency
When the processor hits a break point and is then single stepped, the execution counts will likely be
several steps behind the current processor location. This is because the processors’ internal trace
hardware compresses and buffers execution information for multiple instructions before it transmits it
to the trace port. Because the QTrace Analyser does not have access to the JTAG port it cannot flush the
buffer and thus there will be latency in execution count updates. This does not result in any trace data
being lost however.
3.2.4
Loop timing
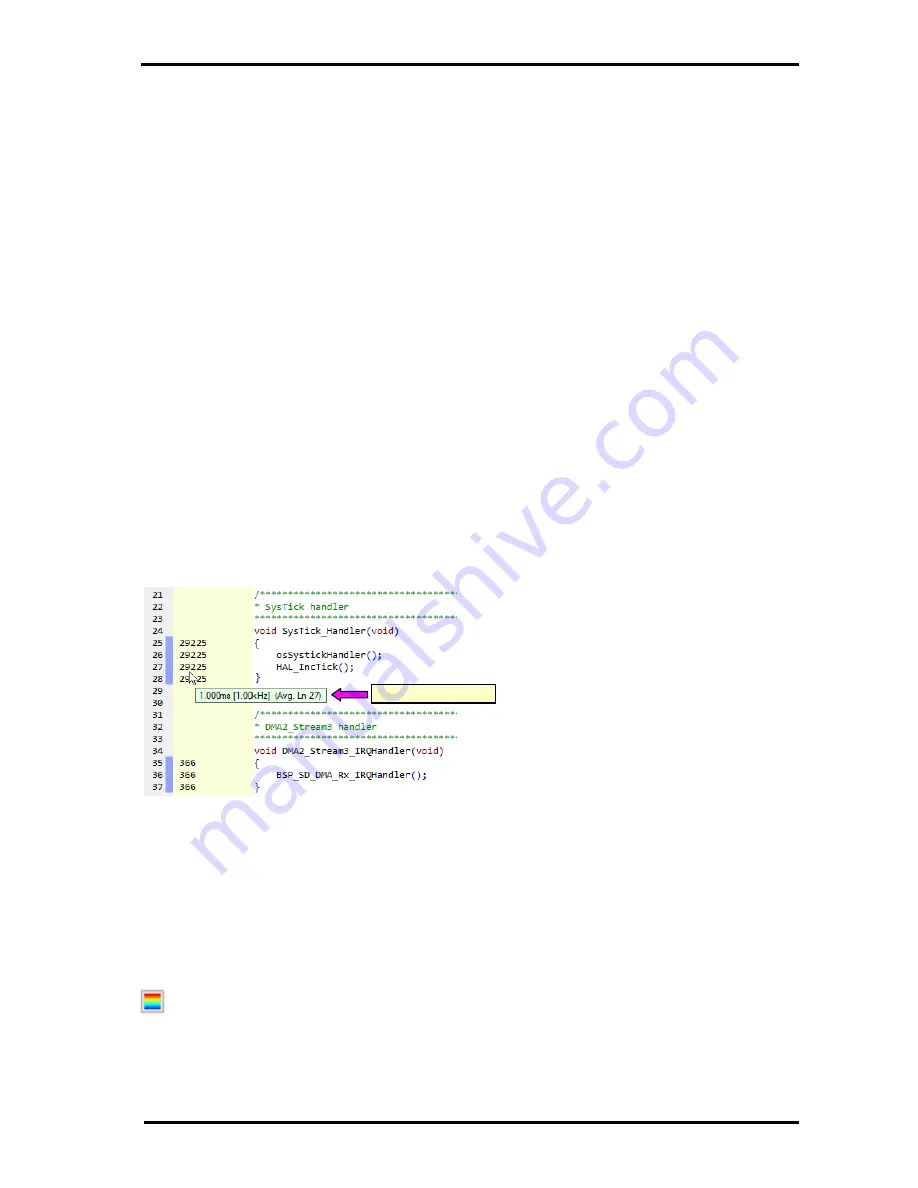
There are many occasions while debugging when knowing the timing of a loop is very helpful. Examples
include interrupt rates, timer periods, state machine cycle times, thread execution intervals, etc. The
QTrace Analyser shows this information effortlessly and without the need to modify the code to toggle
an I/O pin to view on an oscilloscope. By simply hovering the mouse cursor over an incrementing
execution count in the source file view will cause a pop-up window to be displayed that shows the rate
at which the line of code is being executed. Filtering is applied to the timing calculation with a time
constant of several seconds to derive an accurate average rate.
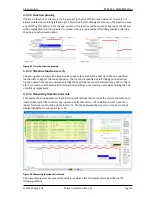
Figure 11 shows an example of loop timing for the SysTick handler which is being called every
millisecond as expected.
Figure 12 Source view loop timing
3.2.5
Execution heat map
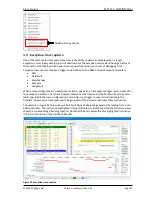
On the right hand side of the source view, left of the vertical scrollbar, a thin resizable vertical window
shows an overview of the lines that have been executed in the current source file. Coloured lines on the
heat map denote source lines that have been executed. The colour of each line indicates the execution
count for that line as a percentage of the total number of counts in the source file. The colours range
from blue for the smallest number of counts up to red for the largest number. This is depicted by the
colours on the heat-map set-up button at the top right of the source view:
When the button is pressed, a pop-up menu appears allowing the appearance of the heat map to be
changed. The width of the heat map can be changed by moving the mouse cursor over the left edge
then clicking and dragging. Also, any source line can be instantly scrolled into view by clicking on an area
Loop timing pop-up


