Trace Capture
QT
RACE
-
U
SER
M
ANUAL
© 2018 PDQLogic Ltd.
QTrace User Manual Rev 1.01
Page 23
When the new trigger parameters have been entered, clicking the ‘Apply’ button [11] will cause them to
take effect.
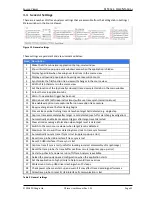
Trace capture can be globally enabled / disabled by selecting menu option
Capture
Enable.
When the
target trace is first configured trace capture is globally enabled. Whenever a trigger event occurs,
further trace captures are disabled i.e. they are globally disabled and have to be explicitly re-enabled.
When trace capture is globally disabled and the currently viewed trigger is enabled then the check box
[7] will be displayed as:
If a trigger has been designated for CPU exception handlers by ticking check box [8] then it will remain
enabled even when triggers are globally disabled. Only one trigger can be assigned to exception
handlers and it will always be enabled until it triggers. Any previous non-exception capture data will be
overwritten by the exception data as it is likely to be of more interest. See section 4.3 for further details
of exception trace capture.
4.1.1
Trace Point
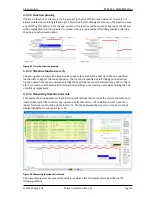
A trace point is used to generate a call stack view, in a similar way to an IDE when a breakpoint is hit but
without stopping the CPU. By selecting any line of code in the source view and then pressing F9 a
temporary trace capture is defined. This is a temporary trace capture trigger in addition to the four
detailed in section 4.1. It is essentially a single source line based trigger with a hit count of 1. The left
hand margin for the line in which a trace point is defined is coloured brown. Note that only one trace
point can be defined and, unlike the other four triggers, the trace point is not reinstated when the
QTrace Analyser is restarted.
4.2
Trace capture view
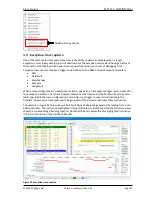
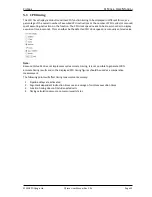
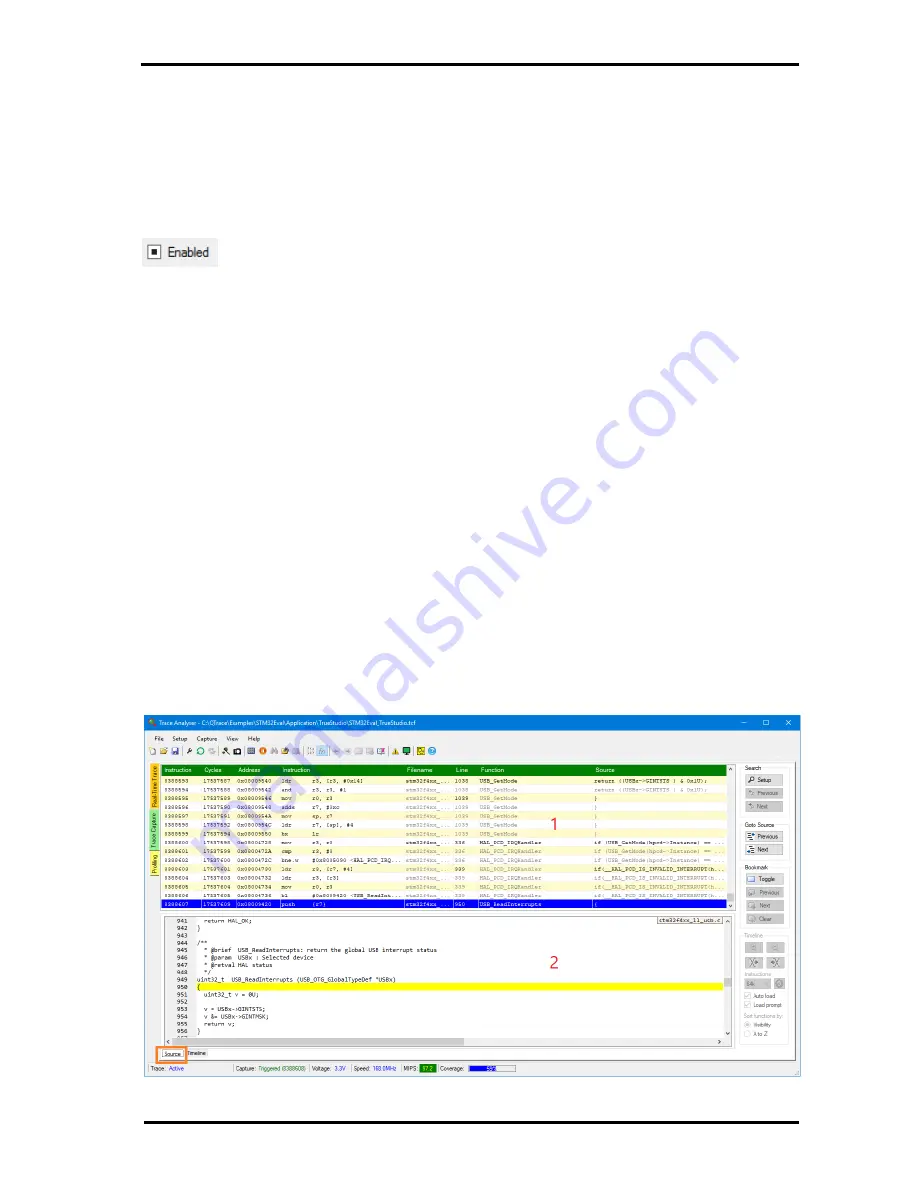
When a trace capture event occurs, the trace capture view will become active. Depending on the
selection of the highlighted tab control at the bottom left corner, this view will have 2 or 3 resizable
areas and a collection of controls. The resizable areas are:
1. CPU instruction list view
2. Simple source view
3. Function Timeline (see Figure 22 on the next page)
Figure 21 Trace capture without the timeline shown


