Trace Start Sequence
QT
RACE
-
U
SER
M
ANUAL
© 2018 PDQLogic Ltd.
QTrace User Manual Rev 1.01
Page 42
7.
Trace Start Sequence
After the target application has been compiled and the IDE has entered debug mode, the target
processor will typically be reset and its FLASH programmed via the JTAG adapter. A target reset will be
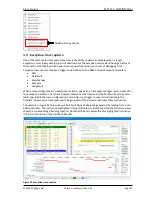
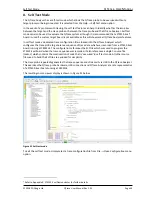
inferred by the QTrace Analyser as a loss of trace clock and a message will be displayed:
Figure 48 Target reset inferred
The QTrace Analyser icon in the Windows Taskbar will also indicate the change of target state by
changing colour to yellow:
Before target execution is started, the IDE will run the specified debugger script (section 6.1.15, page 40)
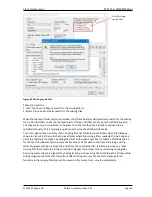
to configure the target trace interface. Once this is done, and the QTrace Analyser has detected a valid
trace data stream, the display will change to that shown in Figure 49. If the QTrace Analyser is unable to
synchronise with the trace data stream then an error message will be displayed.
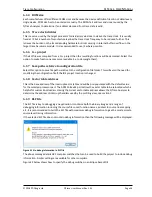
If this happens the target should be reset from within the IDE to re-run the debugger script. The QTrace
Analyser will then try again to synchronise to the trace data. If the error persists, click the blue ‘Help’
hyperlink in the error message to display the diagnostics dialog (also detailed in section 11).
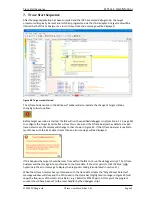
When the QTrace Analyser has synchronised with the trace data stream the “Target Reset Detected”
message window will close and the CPU speed in the status bar (highlighted in orange in Figure 49) will
show the frequency of the internal oscillator, e.g. 16MHz for STM32 parts. At this point the program
counter should have been set to the reset handler by the debugger script.


