Tracing with common IDEs
QT
RACE
-
U
SER
M
ANUAL
© 2018 PDQLogic Ltd.
QTrace User Manual Rev 1.01
Page 52
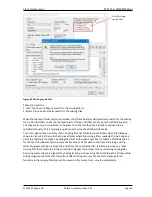
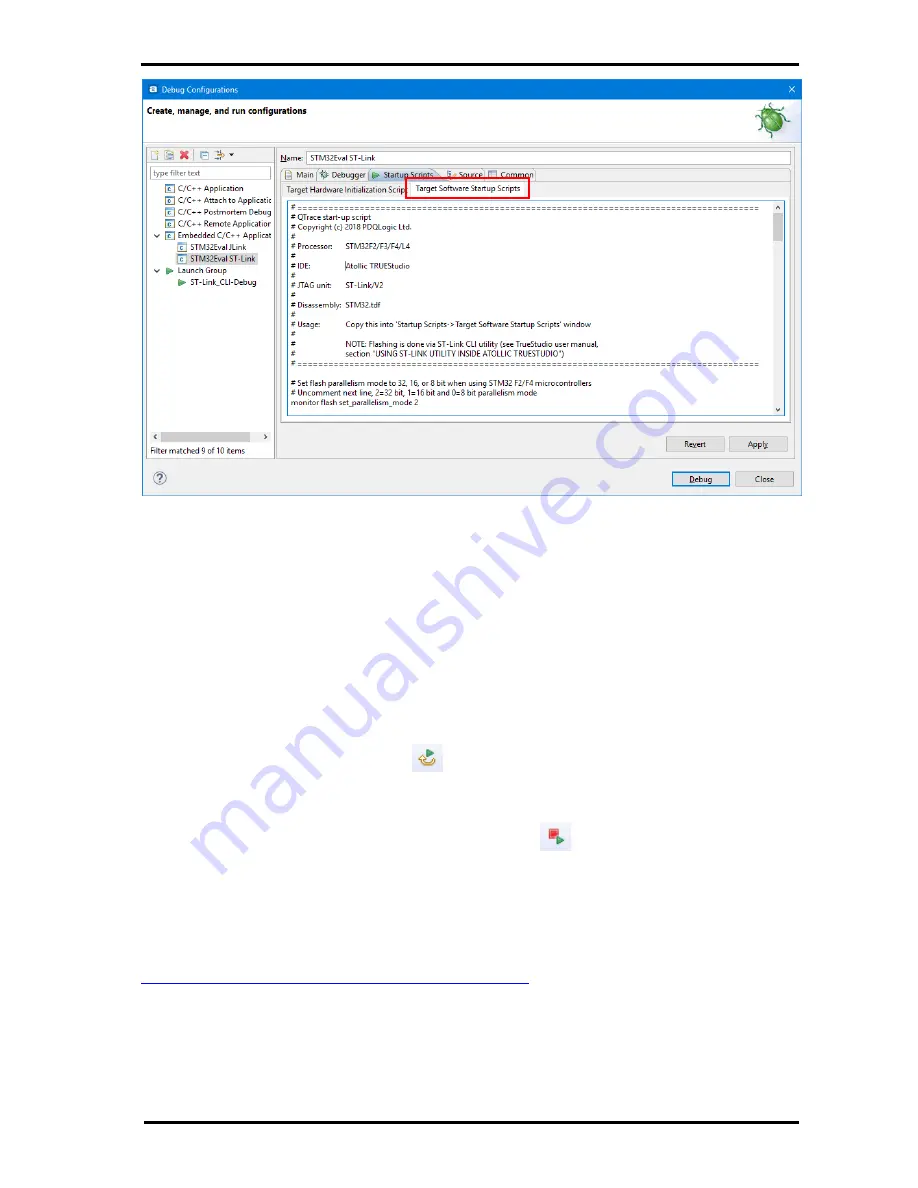
Figure 55 Atollic TrueSTUDIO debugger script
For the J-Link adapter, this is all that is required. When the debugger is started, the script will flash the
processor, initialise the trace interface and halt at the reset vector ready to start running. For the ST-
Link adapter the process is slightly different.
Unlike the J-Link GDB server, the ST-Link GDB server supplied with TrueSTUDIO will not compare the
image programmed into the target FLASH with the image embedded in the ELF file to determine if the
FLASH needs to be re-programmed. This means that the FLASH will be programmed unconditionally.
This is less of an issue when starting a debug session but it can add 10’s of seconds to a processor
restart operation which is often needed when debugging and is sometimes needed if the QTrace
Analyser is unable to synchronise with the target trace after the debug script has been run.
Although the TrueSTUDIO ‘Restart’ button
can be used to reset the processor, it does not (as of
V9.0.0) issue a hard reset and then re-run the debugger script. As a result, the QTrace Analyser will not
detect a target reset and will not automatically clear its internal state, including code coverage.
A workaround is to press the ‘Terminate and Re-launch’ button
to restart a new debug session and
re-run the debugger script (you may need to pause execution first). This will reset the processor and re-
initialise the trace hardware but it will not reprogram the target FLASH as this step is intentionally
omitted from the script.
To program the FLASH at the start of a debug session, the STM32 ST-Link CLI utility is used. This is
available on the ST website at:
http://www.st.com/en/development-tools/stsw-link004.html

