background image

Trace Capture


QT

RACE 

-


U

SER 

M

ANUAL


© 2018 PDQLogic Ltd.


QTrace User Manual Rev 1.01


Page 22


4.


Trace Capture  

The QTrace Analyser will continually decode trace data streamed data from the QTrace probe. It 
maintains a buffer of the last 8 million instructions traced and can freeze the buffer at any time. This is 
referred to as 

trace capture

. After the trace buffer has been frozen it can be viewed and analysed while 

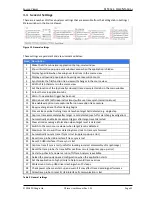
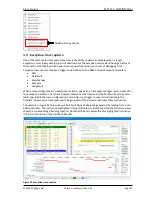
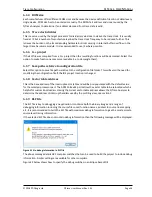
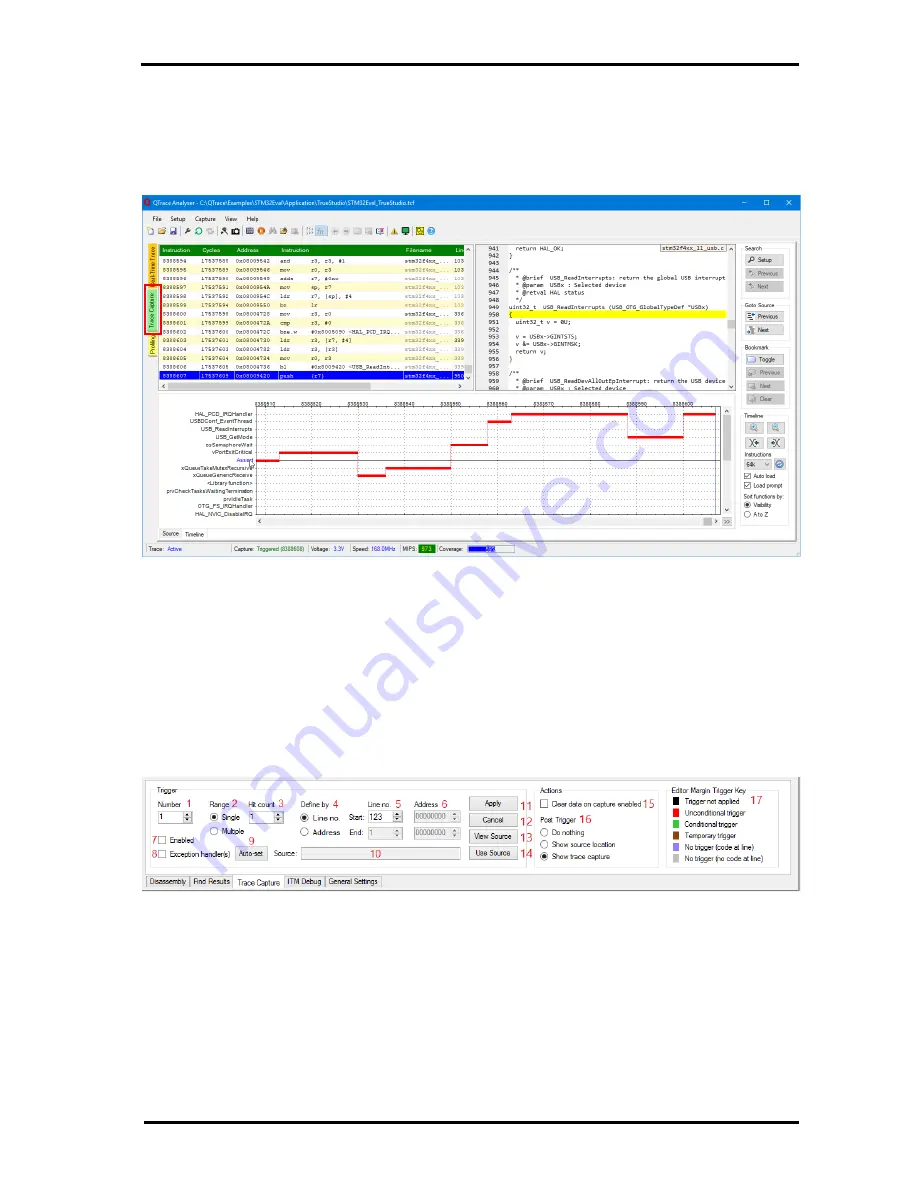
trace data decoding continues as normal. A typical view is shown below: 


Trace capture is typically used to determine how the processor ended up executing a particular area of 
code. There are 3 common scenarios: 

1. Determine at any time where a function in the source view is being called from 
2. Detect if a specific address or source line, or range, is executed 
3. Reveal where a CPU exception was triggered  

4.1


Trace Capture Trigger 

All cases above require a trigger condition to be defined. For case 1 this is achieved with a single key 
press, see section 4.1.1. Cases 2 and 3 require several parameters to be specified which is done in the 
Trace Capture tab in the setup/status view:  


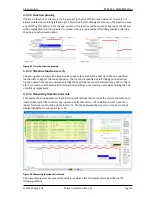
Figure 20 Trace capture set-up 

There are four triggers available which are selected using [1]. Each trigger can be configured for a single 
or range of source lines or addresses [2], [4]. When a single source line or address is specified, a 'hit 
count' [3] can also be specified so that a trigger will not occur until the line / address has been executed 
a specified number of times.  

If a source line based trigger is required then rather than manually specifying the lines in [5] click the 
required line(s) in the source file view to enable the 'Use Source' button [14] which when clicked will 
populate the line number(s) [5]. If the trigger was previously configured for a source line based trigger 
then clicking the 'View Source' button [13] will highlight the current settings in the source file view. Each 
trigger can be enabled or disabled via the 'Enabled' check box [7]. 

Summary of Contents for QTrace

Page 1: ...INTRODUCTION QTRACE USER MANUAL Revision 1 01 August 2018 QTRACE USER MANUAL ...

Page 2: ...ping and execution count latency 16 3 2 4 Loop timing 16 3 2 5 Execution heat map 16 3 2 6 Navigating to function implementations 17 3 2 7 Find text 17 3 2 8 Find function from clipboard 18 3 2 9 Source view bookmarks 18 3 3 ITM DEBUGGING 19 3 4 GENERAL SETTINGS 21 4 TRACE CAPTURE 22 4 1 TRACE CAPTURE TRIGGER 22 4 1 1 Trace Point 23 4 2 TRACE CAPTURE VIEW 23 4 2 1 CPU instruction list view 24 4 2 ...

Page 3: ...pt 40 6 1 16 Trace port voltage 40 6 2 FINALISING TRACE CONFIGURATION 40 7 TRACE START SEQUENCE 42 8 SELF TEST MODE 44 9 RECOMMENDATIONS 45 9 1 GENERAL 45 9 2 PROGRAMMING TIPS 45 10 PC SPECIFICATION 46 11 TROUBLESHOOTING 47 12 TRACING WITH COMMON IDES 49 12 1 LOCATION OF DEBUGGER SCRIPTS 49 12 2 EXAMPLE PROJECTS 49 12 3 SEGGER J LINK INSTRUCTION SIMULATION 50 12 4 ATOLLIC TRUESTUDIO 51 12 5 IAR EM...

Page 4: ...Document History Revision Date Changes 1 00 12 07 18 First release 1 01 06 08 18 Finalising trace configuration section added ...

Page 5: ...re 3 An external trace probe is required to decode the trace data frames streamed by the trace port and transmit their payload data to a host PC By implementing a high speed communication link between the trace hardware probe and PC it is possible to stream the trace data directly to the PC without the need to capture and then review offline This allows a continuous view of what the target applica...

Page 6: ...cripts are supplied with the QTrace Analyser to support most common IDEs as shown in Table 1 below IDE Version Tested See Section Atollic TrueSTUDIO V9 0 0 12 4 IAR Embedded Workbench V8 20 12 5 Keil MDK V5 20 12 6 Segger Embedded Studio V3 34 12 7 ST System Workbench V2 4 12 8 VisualGDB V5 3r5 12 9 Table 1 Supported IDEs 1 4 Supported target devices The QTrace probe will interface to any ARM Cort...

Page 7: ...Figure 3 1 6 QTrace hardware specification The following gives an overview of the QTrace hardware specifications Parameter Min Max Units Power supply USB 3 0 powered Voltage 4 0 6 0 Volts Current 300 mA Input voltage3 range 1 1 8V nom Vin Low 0 2 0 38 Volts Vin High 0 8 3 6 Volts Input voltage3 range 2 3 3V nom Vin Low 0 2 0 8 Volts Vin High 2 0 3 6 Volts Target clock frequency FTarget Trace clock...

Page 8: ...nnector close to the processor pins Add 0402 series termination resistors e g 22R next to the processor trace pins Use low capacitance ESD diodes on the trace signals and place them close to the trace connector Keep tracks the same length Do not insert vias Route all tracks over an unbroken ground plane which is on the first inner layer the FR4 laminate thickness between the top and ground plane l...

Page 9: ...1 10 Precautions There are several issues to be aware of when using the QTrace probe 1 Do not connect a powered target processor to an unpowered QTrace probe i e when it isn t connected to a PC via a USB 3 0 lead Doing so will cause internal ESD diodes to continuously conduct which may damage them It may also damage the trace pins on the target processor 2 The QTrace probe should not be connected ...

Page 10: ... x x x exe This will install the QTrace Analyser application scripts documentation and a USB3 driver Note that the installer will silently request Administrator privileges to install the driver and the request may fail If it does the driver will not be installed and this will have to be done manually see Appendix A Manual Driver Installation The QTrace probe actually requires two drivers and Windo...

Page 11: ... code coverage Pause Code Coverage 11 Pause code coverage display update Find in Current File 12 Ctrl F F3 Find text in current file Find in Files 13 Ctrl Shift F Find text in all source files specified by ELF file Find Function From Clipboard 14 Ctrl V Match the function name on the Clipboard and display the source implementation if found Show Indentation Guides 15 Show hide indentation guide lin...

Page 12: ...racing is in progress Green Red flashing A trace capture event occurred Red A target exception or a trace error occurred Table 6 Taskbar icon states 2 2 3 Trace views There are three primary trace views which can be selected using the coloured tabs labelled Trace view select in Figure 5 above Each gives a different visualisation of target program execution 1 Source Viewer 2 Trace Capture 3 Profili...

Page 13: ...ing and there is debug information in the ELF file which specifies their original source file names then ticking the Missing Files check box will show the files and their functions in light grey If the Missing Files check box is disabled then all source files and functions specified in the ELF file have been found and are displayed Functions that cannot be associated with a source file are grouped...

Page 14: ...margin next to the source line The CPU instruction execution counts are displayed in the pink margin of the disassembly window Note that recording execution counts for each instruction is not the same as recording every single instruction that has been executed since reset to allow an entire execution timeline to be reconstructed There is however a similar feature in the QTrace Analyser which is l...

Page 15: ... Inferred time duration Figure 9 Code coverage 2 Multiple conditionals on separate lines Figure 10 Code coverage 3 Only 1 mutex created Figure 11 Code coverage 4 Blocked thread Conditional statements on separate lines quickly show which tests passed failed line 891 didn t execute therefore Device_SaveSettings on line 888 failed 17 x 100ms delays button held between 1 7s 1 8s Line not yet executed ...

Page 16: ... without the need to modify the code to toggle an I O pin to view on an oscilloscope By simply hovering the mouse cursor over an incrementing execution count in the source file view will cause a pop up window to be displayed that shows the rate at which the line of code is being executed Filtering is applied to the timing calculation with a time constant of several seconds to derive an accurate av...

Page 17: ...s view after clicking on a hyperlinked function click the back button on the toolbar Note to disable this feature e g when copying text hold the Ctrl key down while hovering over a function 3 2 7 Find text The source view has a text search feature that can find specified text in the current file or in all available source files that were used to build the ELF file The Find dialog below is displaye...

Page 18: ...ind Function From Clipboard or press Ctrl V If the function name can be matched then the implementation will be displayed in the source view 3 2 9 Source view bookmarks A bookmark can be placed or removed in the current file by selecting menu option View Toggle Bookmark or by pressing Ctrl F2 A marker is placed on the selected line in the margin next to the line number and is remembered between su...

Page 19: ...achieved in the firmware simply writing bytes to a specific memory location effectively creating a debug channel It is possible to redirect the output of standard printf style library functions to this channel by implementing a custom _write function This is typically implemented as a stub function in a file usually named syscalls c For further details of writing to the ITM debug port refer to the...

Page 20: ...ug window These are accessed from the ITM Debug tab in the Settings Status window in the Source Viewer and are summarised in Table 8 Figure 18 ITM debug settings Setting Description 1 Enable disable ITM debug function 2 Number of lines that the debug window can display 3 Wrap lines when they exceed 256 bytes or discard bytes 4 Select the character which will terminate a line 5 Optionally clear the...

Page 21: ...ore tracing begins 13 Prevent trace probe flushing trace data when target halt detected e g single step 14 Capture trace immediately after target reset detected useful for watchdog investigation 15 Automatically enable trace capture triggers after target reset detected 16 Clear all code coverage information when target reset is detected 17 Switch to the main source viewer when target reset is dete...

Page 22: ...trigger condition to be defined For case 1 this is achieved with a single key press see section 4 1 1 Cases 2 and 3 require several parameters to be specified which is done in the Trace Capture tab in the setup status view Figure 20 Trace capture set up There are four triggers available which are selected using 1 Each trigger can be configured for a single or range of source lines or addresses 2 4...

Page 23: ...to be of more interest See section 4 3 for further details of exception trace capture 4 1 1 Trace Point A trace point is used to generate a call stack view in a similar way to an IDE when a breakpoint is hit but without stopping the CPU By selecting any line of code in the source view and then pressing F9 a temporary trace capture is defined This is a temporary trace capture trigger in addition to...

Page 24: ...e number of corresponding source code 6 Function name 7 Source code The most recent record will be highlighted when a trace capture event occurs and it corresponds to the instruction that was executed when the trigger conditions were met The trigger 1 4 which initiated the capture and number of records captured is displayed next to the Capture label in the status bar If the trace point triggered t...

Page 25: ...t function transition to be selected 2 The number of trace records that are converted to entries in the function timeline defaults to the last 65536 This is usually sufficient but can be increased by selecting from a drop down list 3 and then pressing the refresh button 4 The new value will also be used for further trace capture events The refresh button is also used to manually load the timeline ...

Page 26: ...t transition to a specified function left or right of the current position The function is specified by left clicking on the desired function name from the list and then selecting the Search Back or Search Forward menu option There are short cuts to search backwards or forwards by clicking on the function name while holding the Ctrl or Shift key respectively 4 2 3 4 Measuring timeline intervals To...

Page 27: ...rd dialog If the Search by option is set to Function Name or Source file line then pressing the highlighted browse button will display one of the two dialogs below depending on the selected search option Figure 28 Find trace record function file browse dialogs When the search criteria have been entered clicking the Find button will search from the currently selected trace record in the direction s...

Page 28: ...selecting a trace record of interest pressing the bookmark Toggle button will add the record to the bookmark list and will colour the instruction number red as shown in Figure 31 Pressing the button again will remove the bookmark from the list When a bookmarked trace record is selected the entire record will be highlighted red The bookmarks are easily navigated by pressing the Previous and Next bo...

Page 29: ...eated see section 6 page 34 a trace capture trigger is also created for the exception handlers The QTrace Analyser determines the locations of the handlers from the vector table specified in the trace configuration and configures a trigger to cover all instructions in the handlers An exception trace capture will be generated if the processor executes these instructions The example in Figure 32 bel...

Page 30: ... easily be refactored to achieve sequential addresses then indirect exception handlers can be implemented in a single section Each handler will then jump to its respective implementation An example is shown below keep handler functions together in the same section void NMI_Handler_ind void __attribute__ section exception_handlers void HardFault_Handler_ind void __attribute__ section exception_hand...

Page 31: ...3rd party library code or an inherited project Figure 35 Function profiling Any function which is defined by the ELF file which does not have source code available e g a 3rd party library will have a appended to its name To see the corresponding code view of any function in the list which does have the source available double click on the list entry to switch to the main source viewer to see its i...

Page 32: ...ns in the Sort Filter by controls allow library functions to be hidden useful when reviewing just application code and to show hide function filename and static information address length and instruction count Figure 36 Profiling functions in a source file Figure 37 Profiling Interrupt service handlers ...

Page 33: ... to display execution time in seconds This can either be the detected CPU clock speed or a manually entered value Note Because Cortex M does not implement cycle accurate tracing it is not possible to generate 100 accurate timing results and so the displayed CPU timing figures should be used as a comparative measurement The following points will affect timing measurement accuracy 1 Pipeline delays ...

Page 34: ...e configuration dialog 1 2 Drop down lists of supported device manufacturers and parts 3 Summary specification of selected device 4 5 Start address and size of program ROM 6 Trace clock divider is usually fixed at SYS CLK 2 but certain devices offer other options 7 Tick if project is a C project rather than C 8 Tick to save source file paths relative to the configuration file 9 Base address of the...

Page 35: ...ption to allow devices that aren t currently supported by the QTrace Analyser to be trialled Each manufacturer entry corresponds to a device definition file which is located at C Users Public PDQLogic QTraceAnalyser Devices 6 1 2 Part Family This is a drop down list of the supported devices for the selected manufacturer Currently the QTrace Analyser supports the STM32 F2 F3 F4 L4 devices Each entr...

Page 36: ...configuration file folder This will avoid the need for modifying the configuration file if the IDE project location is changed 6 1 8 Vector table address This is the base address of the interrupt vector table and will be pre populated with the default value for the selected processor part The ARM Cortex M parts allow the vector table to be relocated which is helpful for custom bootloaders Having t...

Page 37: ...e ELF file In this case there are a number of controls to the right of the source path list box which allow additional paths to be specified 6 1 11 Missing source files This list box contains any files which can t automatically be found by the QTrace Analyser or which don t exist on the filing system Right clicking any entry in this list box will display a file browser which allows the source file...

Page 38: ...ssing files list to display the Windows Open File dialog as shown in Figure 44 Browse to the top level folder where the missing file is suspected to be Copy and paste the text from the Open File dialog file name to the search text box to initiate a Windows search for the file If the file was found simply double click on its file path in the Open File dialog and the QTrace Analyser will then remove...

Page 39: ... to create a database of instructions to allow the QTrace Analyser to decode trace data for the additional code range e g instruction size branch address etc If the additional code range is a hardcoded boot ROM in the processor it is recommended that the ROM image is uploaded to a file using the debugger or some other utility and then specified in the above dialog If there is no image specified th...

Page 40: ...all Cortex M processor implementations The script will then run a dummy program in RAM for several 100ms to give the QTrace Analyser time to detect and synchronise with the trace data stream A number of debugger scripts are supplied with the QTrace Analyser which support most common IDEs See Table 1 on page 6 for further details Note When using a debugger script it is important that the firmware d...

Page 41: ...ation issues 1 One or more paths manually entered in the search path list Figure 39 item 11 or extracted from the ELF file are not on the filing system or don t contain any relevant source files Click View for a list of paths and to suppress the warning 2 One or more WFE WFI sleep instructions have been detected Click View for their location s and see section 9 1 item 2 for more details 3 CPU exce...

Page 42: ...his is done and the QTrace Analyser has detected a valid trace data stream the display will change to that shown in Figure 49 If the QTrace Analyser is unable to synchronise with the trace data stream then an error message will be displayed If this happens the target should be reset from within the IDE to re run the debugger script The QTrace Analyser will then try again to synchronise to the trac...

Page 43: ...ng trace data which the QTrace Analyser will decode and display The CPU speed and coverage in the status bar will be updated to reflect their new values Figure 50 QTrace Analyser tracing The QTrace Analyser icon in the Windows Taskbar will also indicate that trace data is being streamed from the target by changing colour to green At this point trace is running normally and all QTrace Analyser feat...

Page 44: ... Analyser which configures the trace probe to generate a sequence of trace data which was recorded from a STM32 Eval board running at 180MHz The configuration references the ELF file which was used to program the STM32 Eval board when the trace sequence was recorded It also references a single C source file tasks c which contains the small section of code that is executed in self test mode All oth...

Page 45: ...h time to detect the reset and to re sync to the target trace before execution restarts 6 Disable instruction simulation when using a Segger J Link see section 12 3 7 Connect a second screen to display the QTrace Analyser so that it can be viewed side by side with the IDE debugger 8 Do not place breakpoints on exception handlers The buffered trace data is several instructions behind the current in...

Page 46: ... of the target instruction rate and the incoming data rate dictates the level of processing required by the QTrace Analyser The key indicator of how the QTrace Analyser is performing is the average decode rate It shows how much faster the trace data is being processed compared with the incoming data rate The decode rate will periodically drop as other applications require CPU processing and when W...

Page 47: ...is configured to run user script after target FLASHing reset Target has stopped after being reprogrammed Target watchdog isn t repeatedly firing excessive reset count indicates this 5 Unable to synchronise to trace Trace configuration Check that The IDE is configured to run user script after target FLASHing reset IDE options to enable ETM ITM are deselected The correct TCF ELF files are loaded The...

Page 48: ...o other CPU intensive applications are running The QTrace Analyser option Set application as high priority is selected The Windows power scheme is set for high performance The PC spec is sufficient e g 8GB RAM i5 i7 CPU Execution started with the CPU halted at the reset handler use a breakpoint if required Also try Power cycling the USB hub if resumed from sleep or if trace has been running OK Red...

Page 49: ...s is typically the default for a new configuration 12 2 Example Projects For each IDE detailed in the following sections there is a corresponding example project that is installed with the QTrace Analyser Each project is built around the same core functionality which implements a USB FLASH disk application for the STM32 Eval demonstrator board see Appendix B STM32 Eval Demonstratorfor details This...

Page 50: ...er J Link adapter is to disable instruction simulation to avoid any issues with trace while single stepping code This is done by right clicking on the J Link icon when the debugger has been started and then clicking the Open option in the Windows Tray area In the settings window that is then displayed un tick the Allow instruction set simulation Figure 53 J Link disable instruction simulation ...

Page 51: ...ttps atollic com truestudio Begin by creating a debug configuration for either the ST Link or J Link as detailed in the TrueSTUDIO user manual section STARTING THE DEBUGGER A ST Link configuration is shown below Figure 54 Atollic TrueSTUDIO debug configuration In the text box on the Target Software Startup Scripts tab paste the appropriate debug script file contents as shown in Figure 55 below see...

Page 52: ...sor restart operation which is often needed when debugging and is sometimes needed if the QTrace Analyser is unable to synchronise with the target trace after the debug script has been run Although the TrueSTUDIO Restart button can be used to reset the processor it does not as of V9 0 0 issue a hard reset and then re run the debugger script As a result the QTrace Analyser will not detect a target ...

Page 53: ...tion example The run configuration is then combined into a Launch Group with the debug configuration described above see Figure 57 To debug the target the run configuration is launched by clicking the TrueSTUDIO Run button This will launch ST Link CLI programming utility and when it has finished the debug configuration will be activated and debugging can begin For full details of this mode see the...

Page 54: ... 2018 PDQLogic Ltd QTrace User Manual Rev 1 01 Page 54 Figure 57 Atollic TrueSTUDIO launch group example The following figures show how to disable the trace options for both ST Link and J Link Figure 58 Atollic TrueSTUDIO ST Link trace disabled ...

Page 55: ...Tracing with common IDEs QTRACE USER MANUAL 2018 PDQLogic Ltd QTrace User Manual Rev 1 01 Page 55 Figure 59 Atollic TrueSTUDIO J Link trace disabled ...

Page 56: ...e only step required for IAR Embedded Workbench is to specify the debugger script path for the selected device type see section 12 1 on page 49 and to un tick the Run to check box The dialog for these settings is displayed by selecting the Project Options menu option Figure 60 IAR Embedded Workbench specify debugger script path ...

Page 57: ...e section 12 1 on page 49 for the selected device type and to un tick the Run to main check box shown in Figure 61 The dialog for these settings is displayed by selecting the Project Options menu option The second step is to ensure SWO tracing is disabled in the Target Driver Setup dialog accessed by clicking Settings Figure 61 Keil MDK specify debugger script path Figure 62 Keil MDK disable SWO t...

Page 58: ... as the Run To function see Figure 63 Figure 63 Segger Embedded Studio start up settings The second group of settings to configure are the Target Script File path and the Debug Begin Script Reset Script functions as shown in Figure 64 See section 12 1 on page 49 for script paths Figure 64 Segger Embedded Studio debugger script settings Note After entering debug mode and re programming the target i...

Page 59: ...enstm32 org Currently only the ST Link is supported for ST System Workbench There are two steps required Firstly create a debug configuration as detailed here http www openstm32 org Creating 2Bdebug 2Bconfiguration Next set the debugger script path as shown in Figure 65 and then configure a break point to be set at the reset handler as shown in Figure 66 See section 12 1 on page 49 for script path...

Page 60: ...Tracing with common IDEs QTRACE USER MANUAL 2018 PDQLogic Ltd QTrace User Manual Rev 1 01 Page 60 Figure 66 ST System Workbench break at reset handler ...

Page 61: ...up GDB commands need to be edited as shown in Figure 67 Figure 67 VisualGDB ST Link configuration For convenience the Advanced Settings are reproduced here Command line Startup GDB commands f interface stlink v2 cfg f target stm32f4x cfg f C Users Public PDQLogic QTraceAnalyser Debugger Scripts VisualGDB VisualGDB_STM32_STLink cfg c init c reset init set remotetimeout 60 target remote SYS GDB_PORT...

Page 62: ...Tracing with common IDEs QTRACE USER MANUAL 2018 PDQLogic Ltd QTrace User Manual Rev 1 01 Page 62 Figure 68 VisualGDB J Link configuration Figure 69 VisualGDB J Link debugger script ...

Page 63: ...then this will prevent the driver from being installed and a manual installation process is required Procedure 1 Disconnect QTrace from the USB port 2 Browse to DriverSetup exe in the QTrace Analyser installation folder and run it as an Administrator as shown below Figure 70 QTrace probe driver setup path 3 This will initiate a driver install and if successful a message will be displayed If an err...

Page 64: ...ager Figure 71 QTrace probe shown as WestBridge Right click on WestBridge and select the option Update Driver Software from the pop up menu Select Browse my Computer for driver Software in the displayed window then browse to C Program Files PDQLogic QTraceAnalyser Drivers WinXX x64 where WinXX is your Windows version Click Next then Windows will install the driver and will display the following if...

Page 65: ... from ST Microelectronics which has an ETM trace interface connecting to a 20 way trace connector The board also has a micro SD card a USB 2 0 interface LEDs and button Together these are used to demonstrate different features of the QTrace system The STM32F446 comes pre loaded with a USB FLASH disk firmware application to provide access to the onboard micro SD card via USB The application source ...

Page 66: ...dd the following command line to the IDE post build script C Program Files PDQLogic Trace Analyser NoSleep ELF file addr1 addr2 Where ELF file is the full path of your ELF file AddrX are addresses of WFE WFI instructions which will be replaced by NOP instructions When WFE WFI instructions are detected by the QTrace Analyser their details including their addresses are displayed in the Bookmark view...

Reviews: