Appendix B: Technical Reference
919
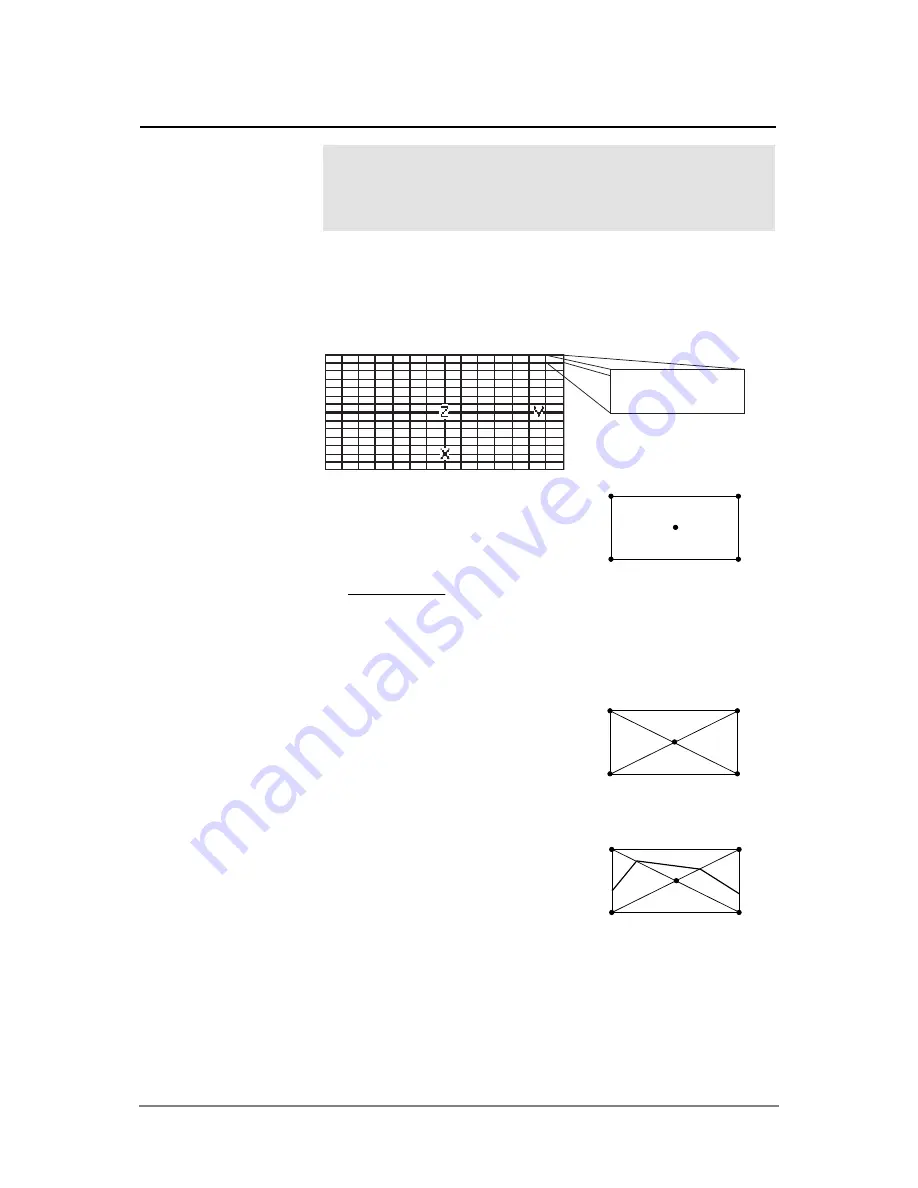
Based on your x and y Window variables, the distance between xmin and
xmax and between ymin and ymax is divided into a number of grid lines
specified by xgrid and ygrid. These grid lines intersect to form a series of
rectangles.
For each rectangle, the equation is
evaluated at each of the four corners
(also called vertices or grid points)
and an average value (E) is
calculated:
E =
z
1
+ z
2
+ z
3
+ z
4
4
The E value is treated as the value of the equation at the center of the
rectangle.
For each specified contour value (C
i
):
¦
At each of the five points shown to
the right, the difference between
the point’s z value and the contour
value is calculated.
¦
A sign change between any two adjacent points implies that a contour
crosses the line that joins those two points. Linear interpolation is used
to approximate where the zero crosses the line.
¦
Within the rectangle, any zero
crossings are connected with
straight lines.
¦
This process is repeated for each
contour value.
Each rectangle in the grid is treated similarly.
z
1
=f(x
1
,y
1
)
z
3
=f(x
2
,y
1
)
E
z
2
=f(x
1
,y
2
)
z
4
=f(x
2
,y
2
)
Contour Levels and Implicit Plot Algorithm
Contours are calculated and plotted by the following method.
An implicit plot is the same as a contour, except that an
implicit plot is for the z=0 contour only.
Algorithm
z
1
ì
C
i
z
3
ì
C
i
E
ì
C
i
z
2
ì
C
i
z
4
ì
C
i
Summary of Contents for Titanium TI-89
Page 9: ...Getting Started 6 TI 89 Titanium keys Ë Ì Í Ê ...
Page 34: ...Getting Started 31 2 or D 2 B u s i n e s s D B D B Press Result ...
Page 43: ...Getting Started 40 3 0 D B D D B D Press Result ...
Page 44: ...Getting Started 41 D 2 0 0 2 D B Scroll down to October and press Press Result ...
Page 58: ...Getting Started 55 Example Set split screen mode to TOP BOTTOM Press Result 3 B D ...
Page 70: ...Getting Started 67 ...
Page 175: ...Operating the Calculator 172 From the Keyboard ...
Page 456: ...Tables 453 ...
Page 527: ...Data Matrix Editor 524 ...


