D5.4
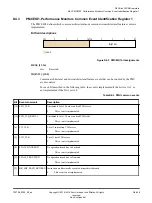
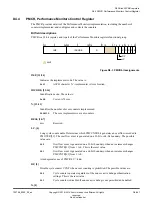
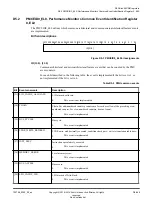
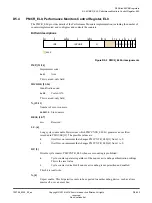
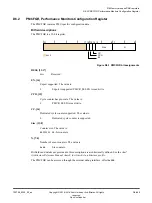
PMCR_EL0, Performance Monitors Control Register, EL0
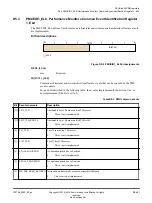
The PMCR_EL0 provides details of the Performance Monitors implementation, including the number of
counters implemented, and configures and controls the counters.
Bit field descriptions
E
31
24 23
16 15
11 10
6 5 4 3 2 1 0
IMP
IDCODE
N
DP X D C P
LC
7
RES
0
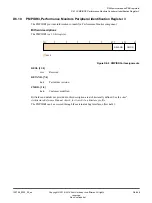
Figure D5-3 PMCR_EL0 bit assignments
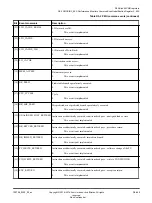
IMP, [31:24]
Implementer code:
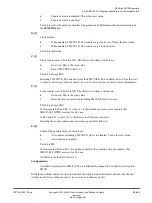
0x41
Arm.
This is a read-only field.
IDCODE, [23:16]
Identification code:
0x0B
Cortex-A76.
This is a read-only field.
N, [15:11]
Number of event counters.
0b00110
Six counters.
RES0, [10:7]
RES0
Reserved.
LC, [6]
Long cycle count enable. Determines which PMCCNTR_EL0 bit generates an overflow
recorded in PMOVSR[31]. The possible values are:
0
Overflow on increment that changes PMCCNTR_EL0[31] from 1 to 0.
1
Overflow on increment that changes PMCCNTR_EL0[63] from 1 to 0.
DP, [5]
Disable cycle counter, PMCCNTR_EL0 when event counting is prohibited:
0
Cycle counter operates regardless of the non-invasive debug authentication settings.
This is the reset value.
1
Cycle counter is disabled if non-invasive debug is not permitted and enabled.
This bit is read/write.
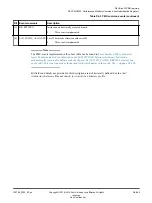
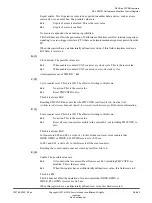
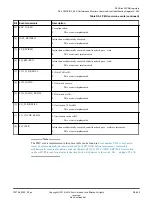
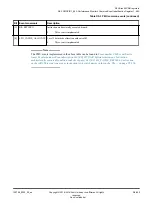
X, [4]
Export enable. This bit permits events to be exported to another debug device, such as a trace
macrocell, over an event bus:
D5 AArch64 PMU registers
D5.4 PMCR_EL0, Performance Monitors Control Register, EL0
100798_0300_00_en
Copyright © 2016–2018 Arm Limited or its affiliates. All rights
reserved.
D5-453
Non-Confidential
Summary of Contents for Cortex-A76 Core
Page 4: ......
Page 22: ......
Page 23: ...Part A Functional description ...
Page 24: ......
Page 119: ...Part B Register descriptions ...
Page 120: ......
Page 363: ...Part C Debug descriptions ...
Page 364: ......
Page 401: ...Part D Debug registers ...
Page 402: ......
Page 589: ...Part E Appendices ...
Page 590: ......

